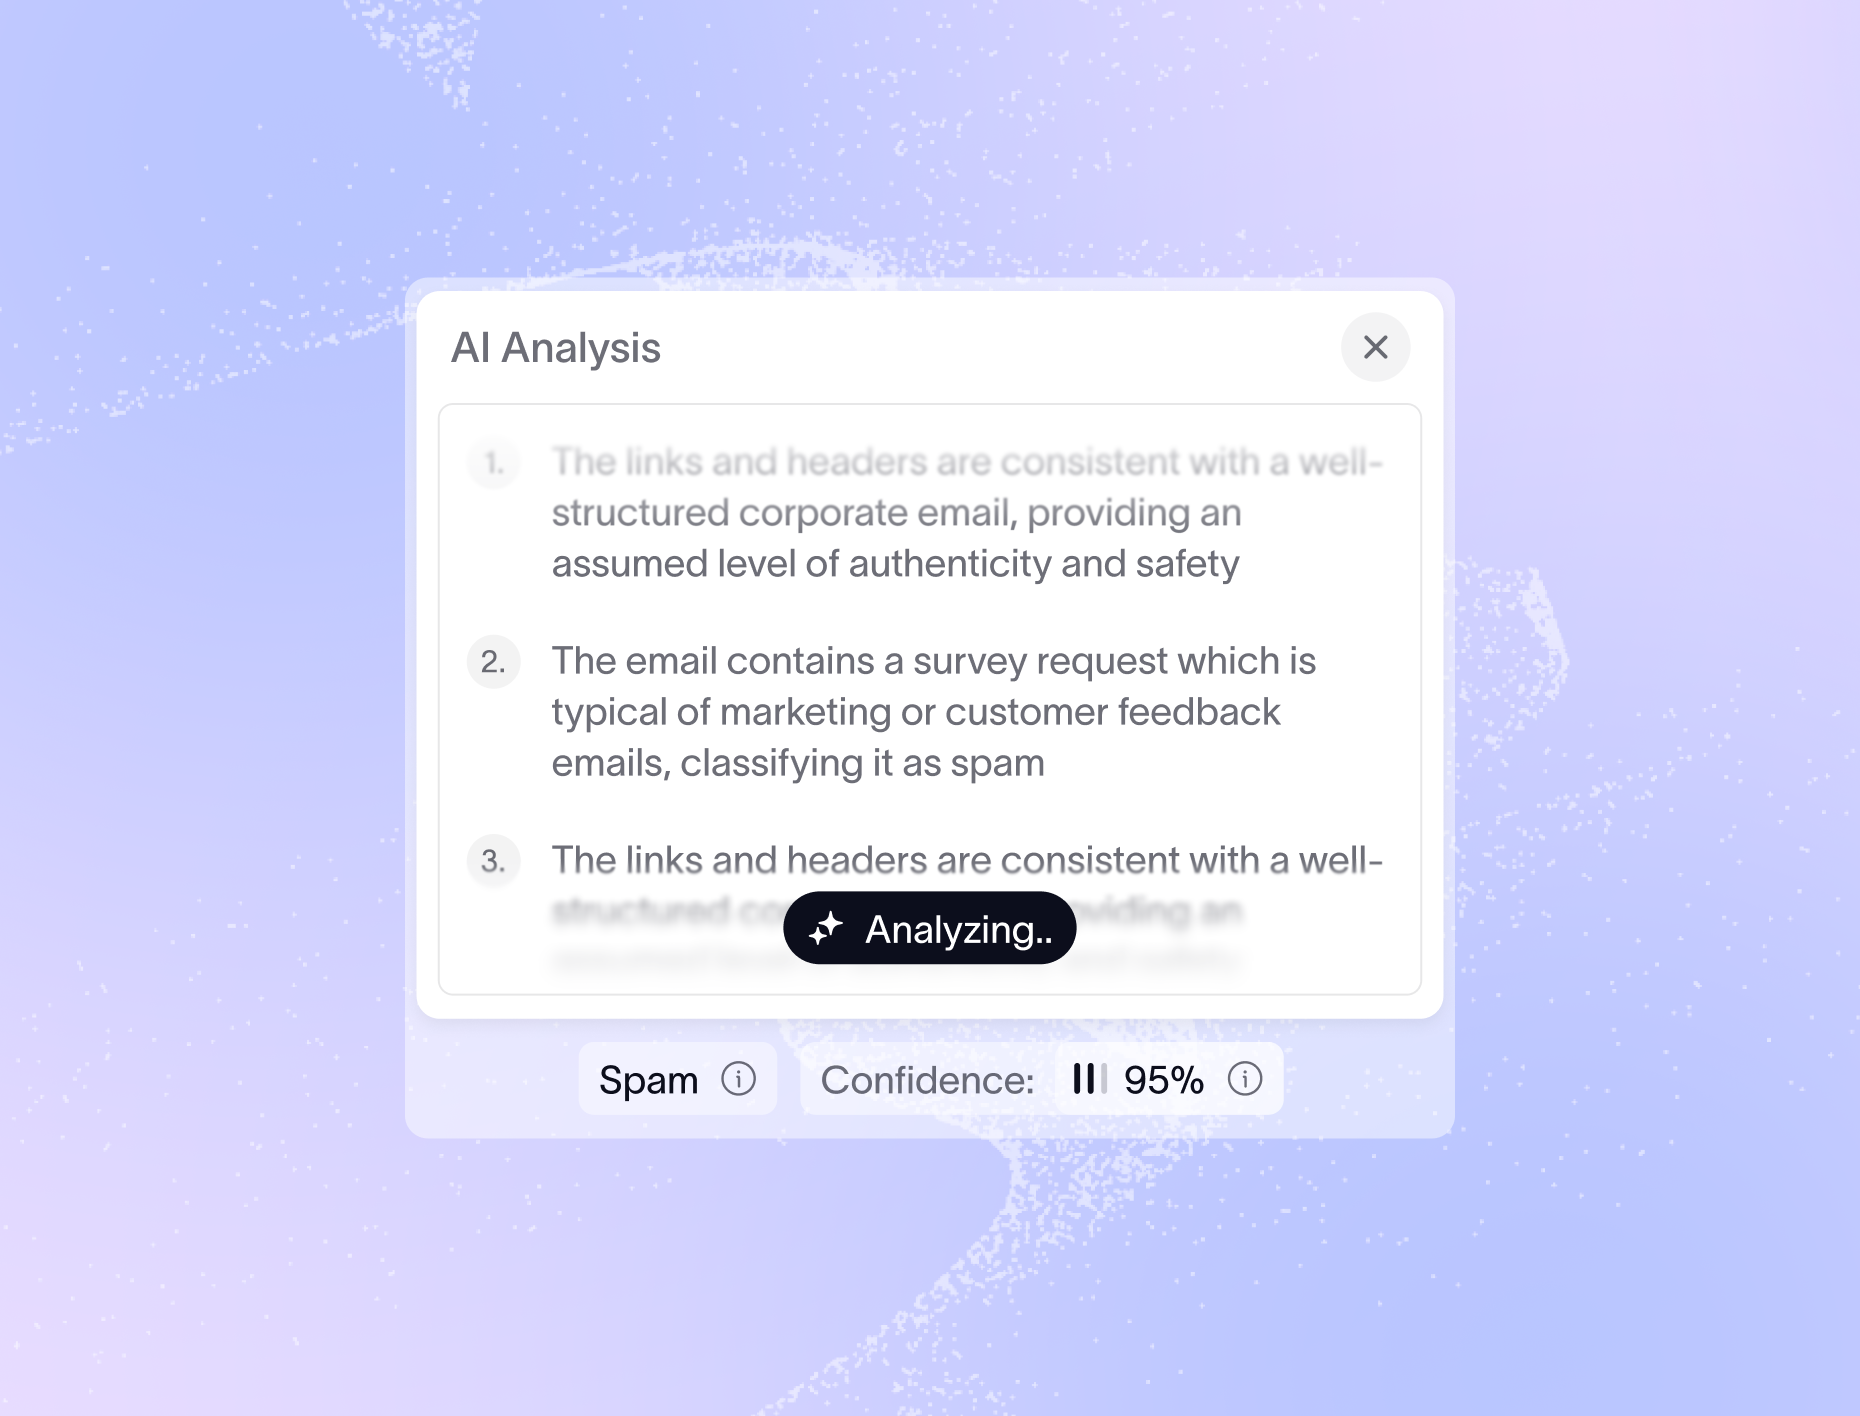


Categorize and analyze customer feedback with AI
For when your team resolves 500 tickets a week but nobody can tell you the top 5 reasons customers write in.

The Challenge
Manual tagging doesn't scale
Agents tag tickets inconsistently. Your top themes depend on who's tagging, not what customers are saying.
Themes shift faster than reviews
By the time your quarterly analysis lands, the top issues have already changed.
Cross-channel blind spots
Support sees tickets, product sees NPS, sales hears calls. Nobody sees the full picture.
How teams use Enterpret today
Situation
A CX leader was asked "what are customers actually complaining about?" The team had 12,000 tickets from the past month and no way to answer without a manual audit.
Action - asked Wisdom, Enterpret's AI assistant
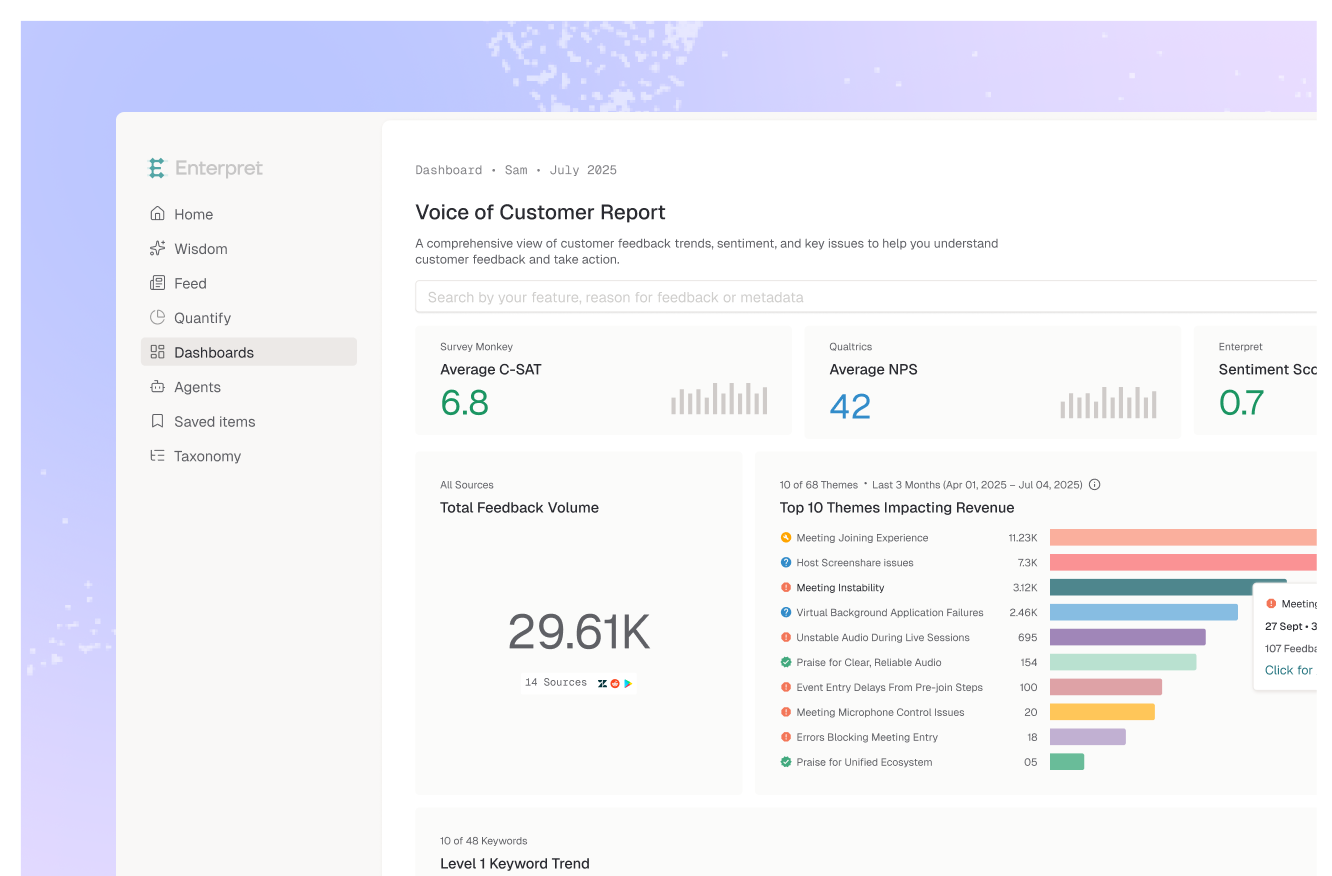
What are the top 10 support themes in the last 30 days, ranked by ticket volume? Show the trend vs. last month.
Impact
Ranked breakdown in under a minute. Discovered "payment processing errors" had jumped 3x in 2 weeks, driven by mobile users. Engineering alerted same day.
Situation
A product team wanted a custom dashboard showing ticket themes by severity with Jira or Linear links — but didn't want to spend hours configuring it manually.
Action - prompted Claude with Enterpret MCP connector
Build me a dashboard showing the top ticket themes ranked by volume, with week-over-week trend and links to related Jira or Linear tickets.
Impact
Claude queried Enterpret via MCP and generated an interactive dashboard with Jira or Linear drill-downs from a single prompt. What would have taken hours was done in 15 minutes.
Situation
After a routine deployment, Datadog showed no errors. But within 3 hours, an automated alert fired in Slack — Enterpret had detected a spike in a specific bug theme from customer reports.
Action -
Action — configured an Enterpret Quality Monitor agent in Slack
Quality Monitor agent scans for feedback themes increasing more than 3x vs. 7-day average and posts to #eng-incidents with context.
Impact
Flagged a checkout flow issue invisible to server monitoring — a UI change confused mobile users. Team identified and reverted the change within hours.