Dashboards & Reporting

Transform customer feedback into clear insights

Turn feedback into measurable signals that show what’s gaining traction, what’s losing ground, and what drives customer satisfaction and business results

Book a demo

The only platform where reporting evolves with intelligence that surfaces insights in real-time

Get instant visibility with ready-made VoC reports

Access pre-built reports designed for product, CX, and leadership teams that organize key feedback metrics and data by themes, sentiment, and impact

See it in action
COLLABORATIVE DASHBOARDS

Share and co-edit so teams can analyze and act together

Scheduled Reports

Automate reports on your cadence. Push dashboard snapshots to any channel

Saved ITEMs & TEMPLATES

Save dashboards and reuse templates to standardize reporting across teams

Move past volume metrics to understand what’s driving change

When feedback is noisy, it’s hard to know what really matters. Quantify themes by revenue, CSAT, and NPS to reveal the “why” behind every trend

See it in action
QUANTIFY IMPACT

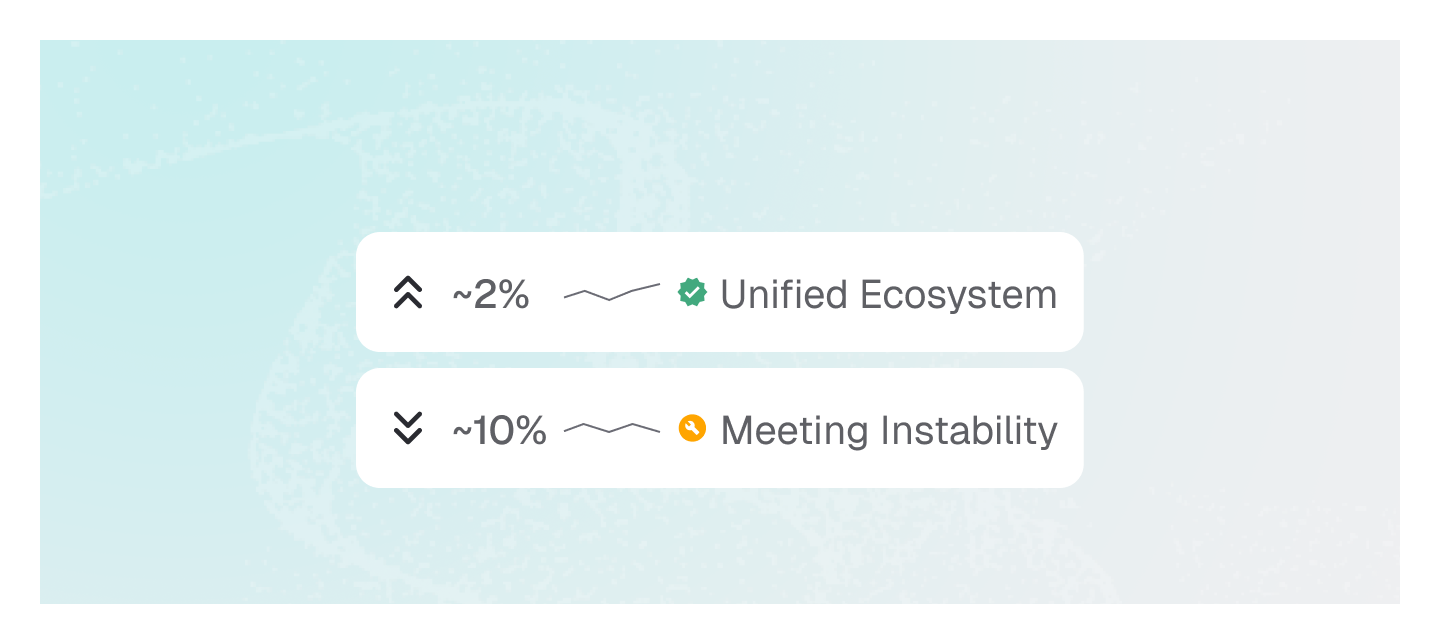
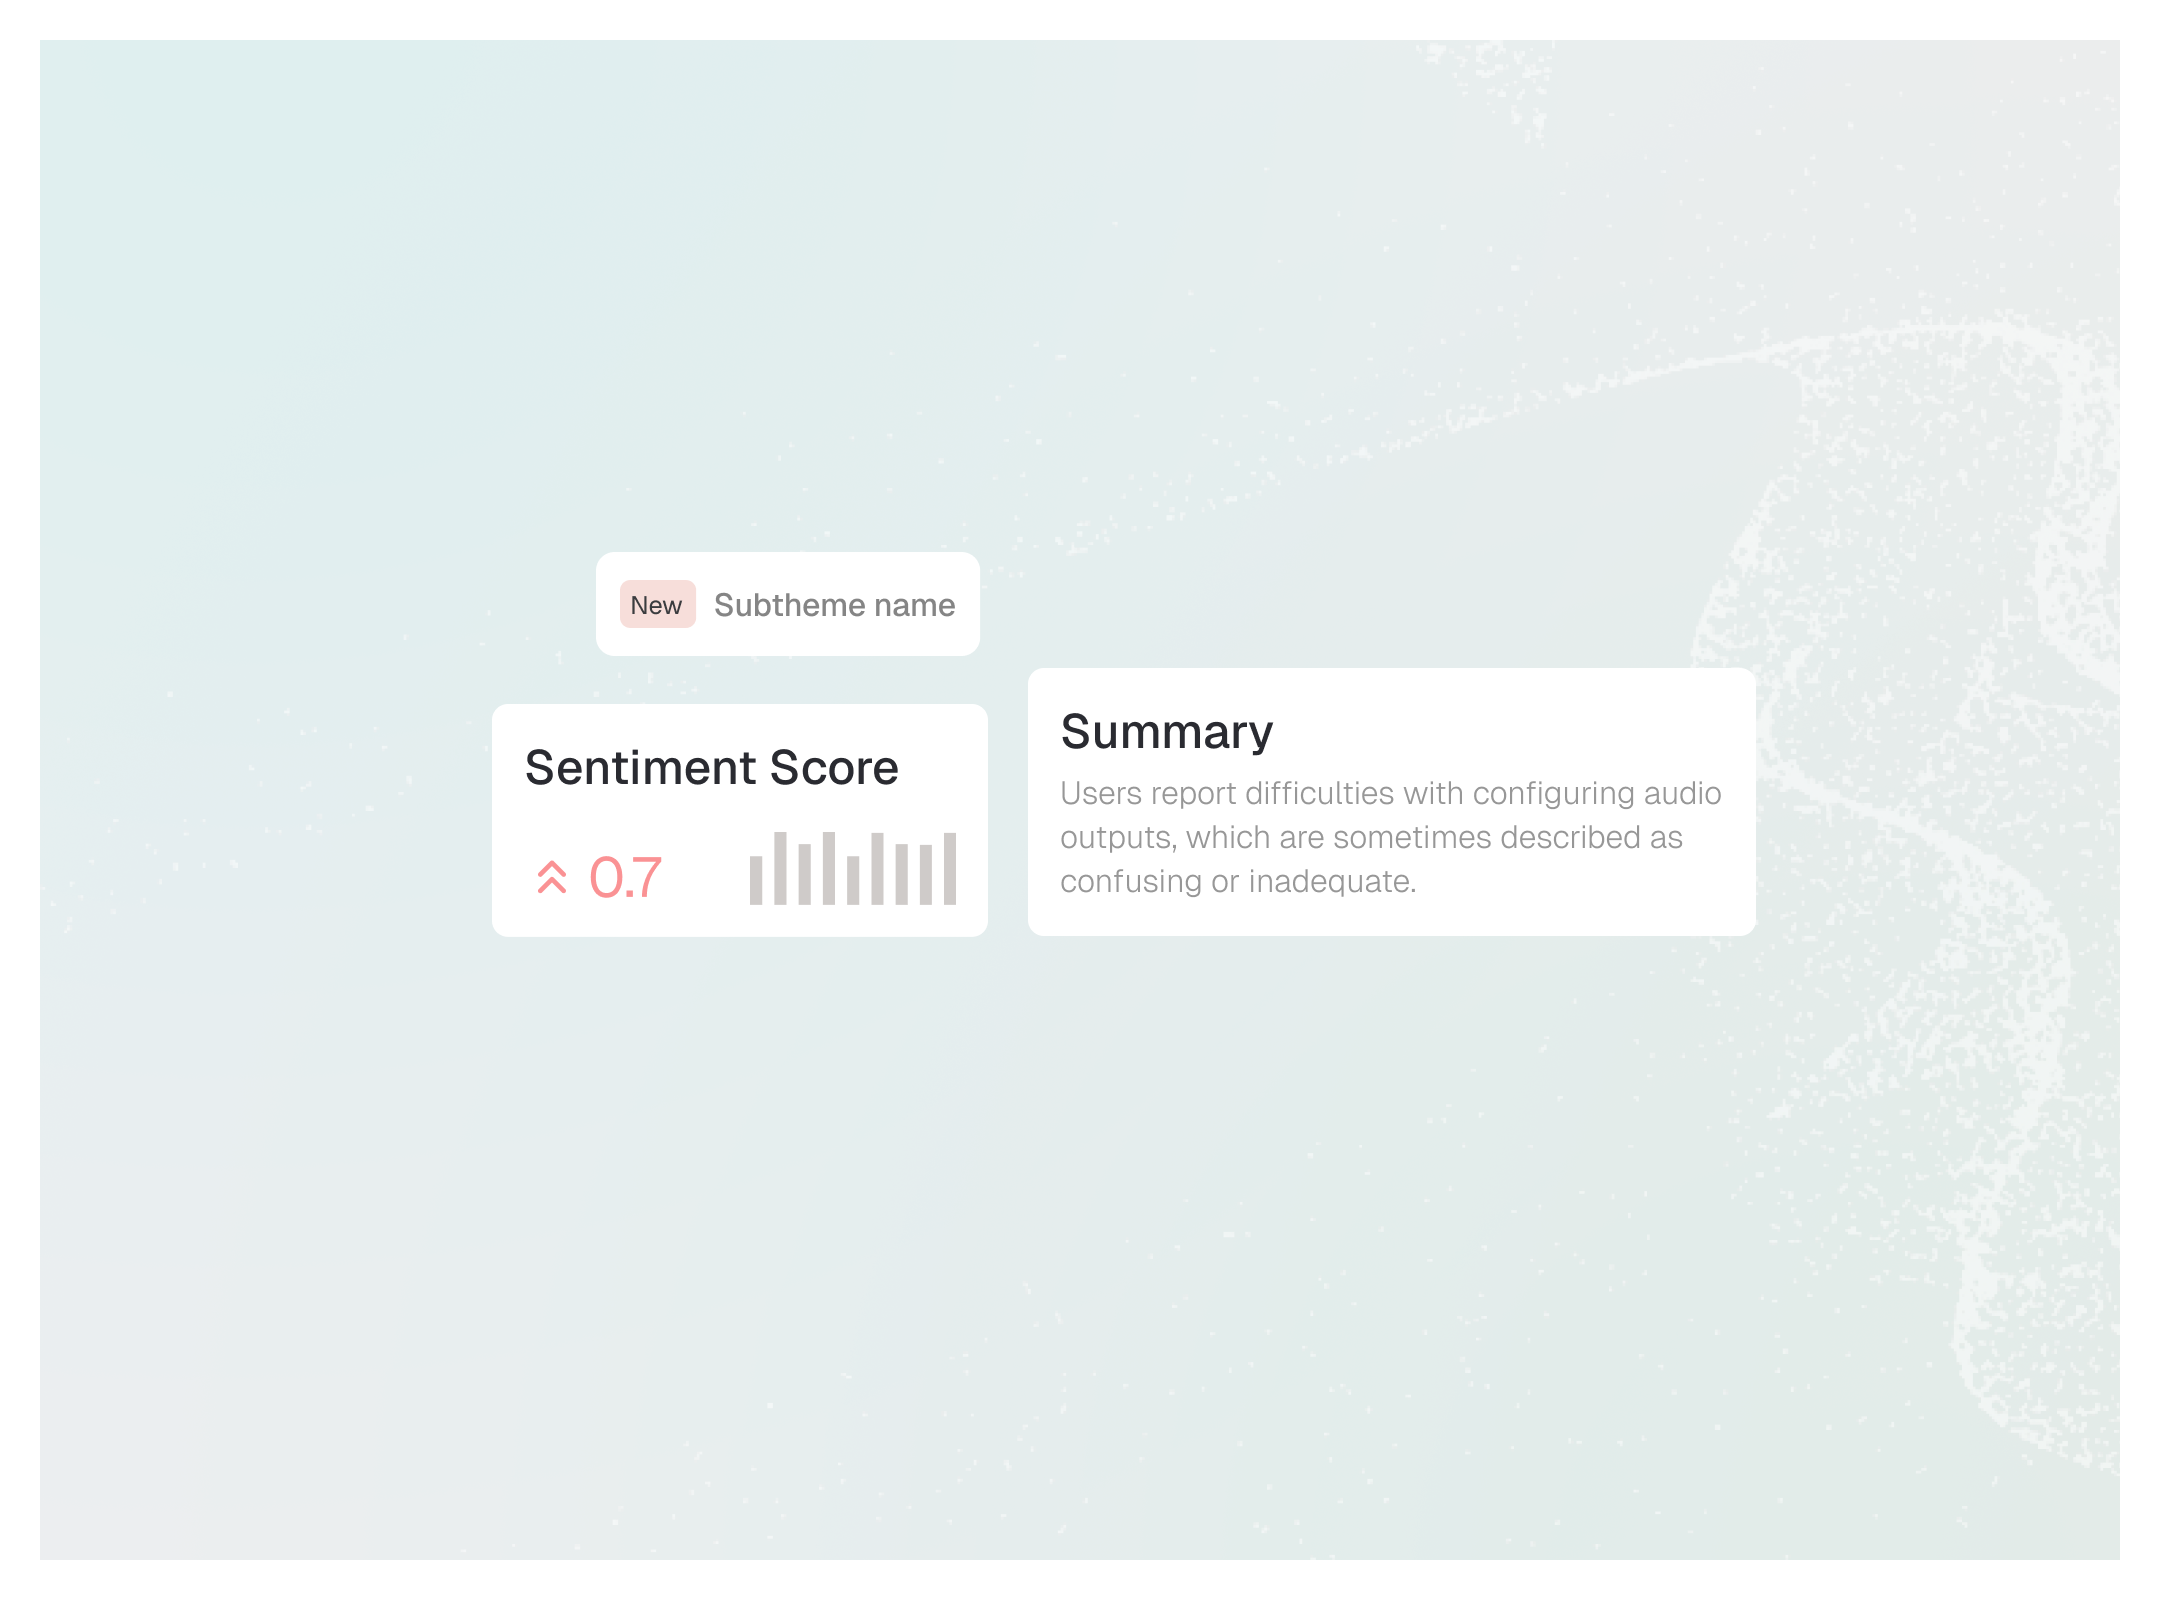
Rank themes by ARR, CSAT, NPS impact, not just volume. Slice by dimensions, no SQL

Comparative Analysis

Compare cohorts, segments, and time periods to isolate what’s changing and why

Feed Views & Summaries

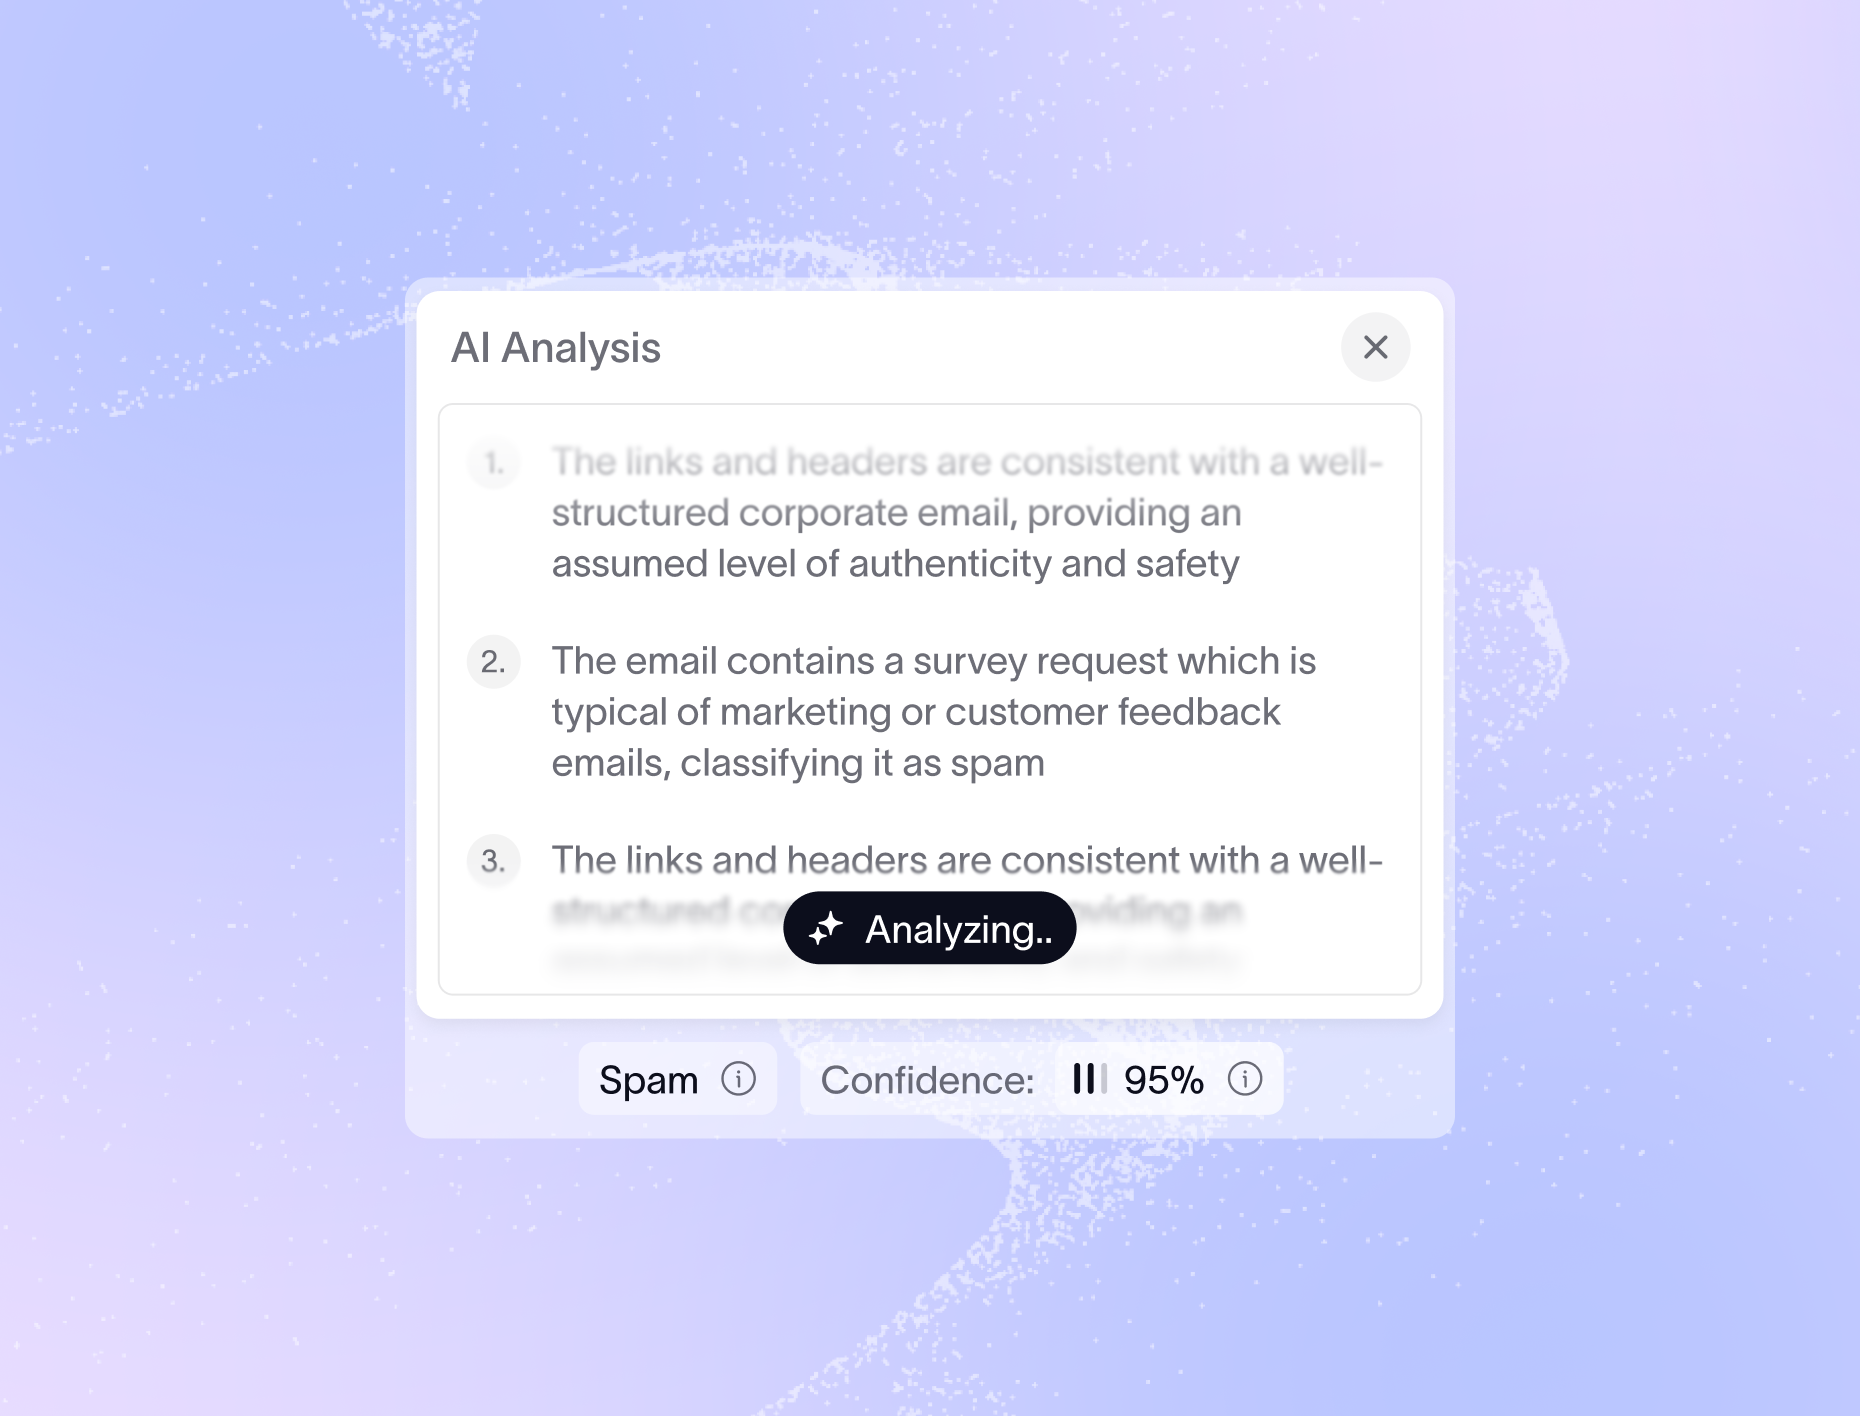
Jump from any chart to verbatim feedback and AI summaries

Summarize insights and track emerging topics in real time

Leverage AI to automatically summarize large volumes of data into clear, contextual insights highlighting what’s driving satisfaction or risk to surface themes for attention

See it in action
Embedded Wisdom AI

Add Wisdom AI to any dashboard. Ask any question, get instant, grounded answers

DETECT Trends & Anomalies

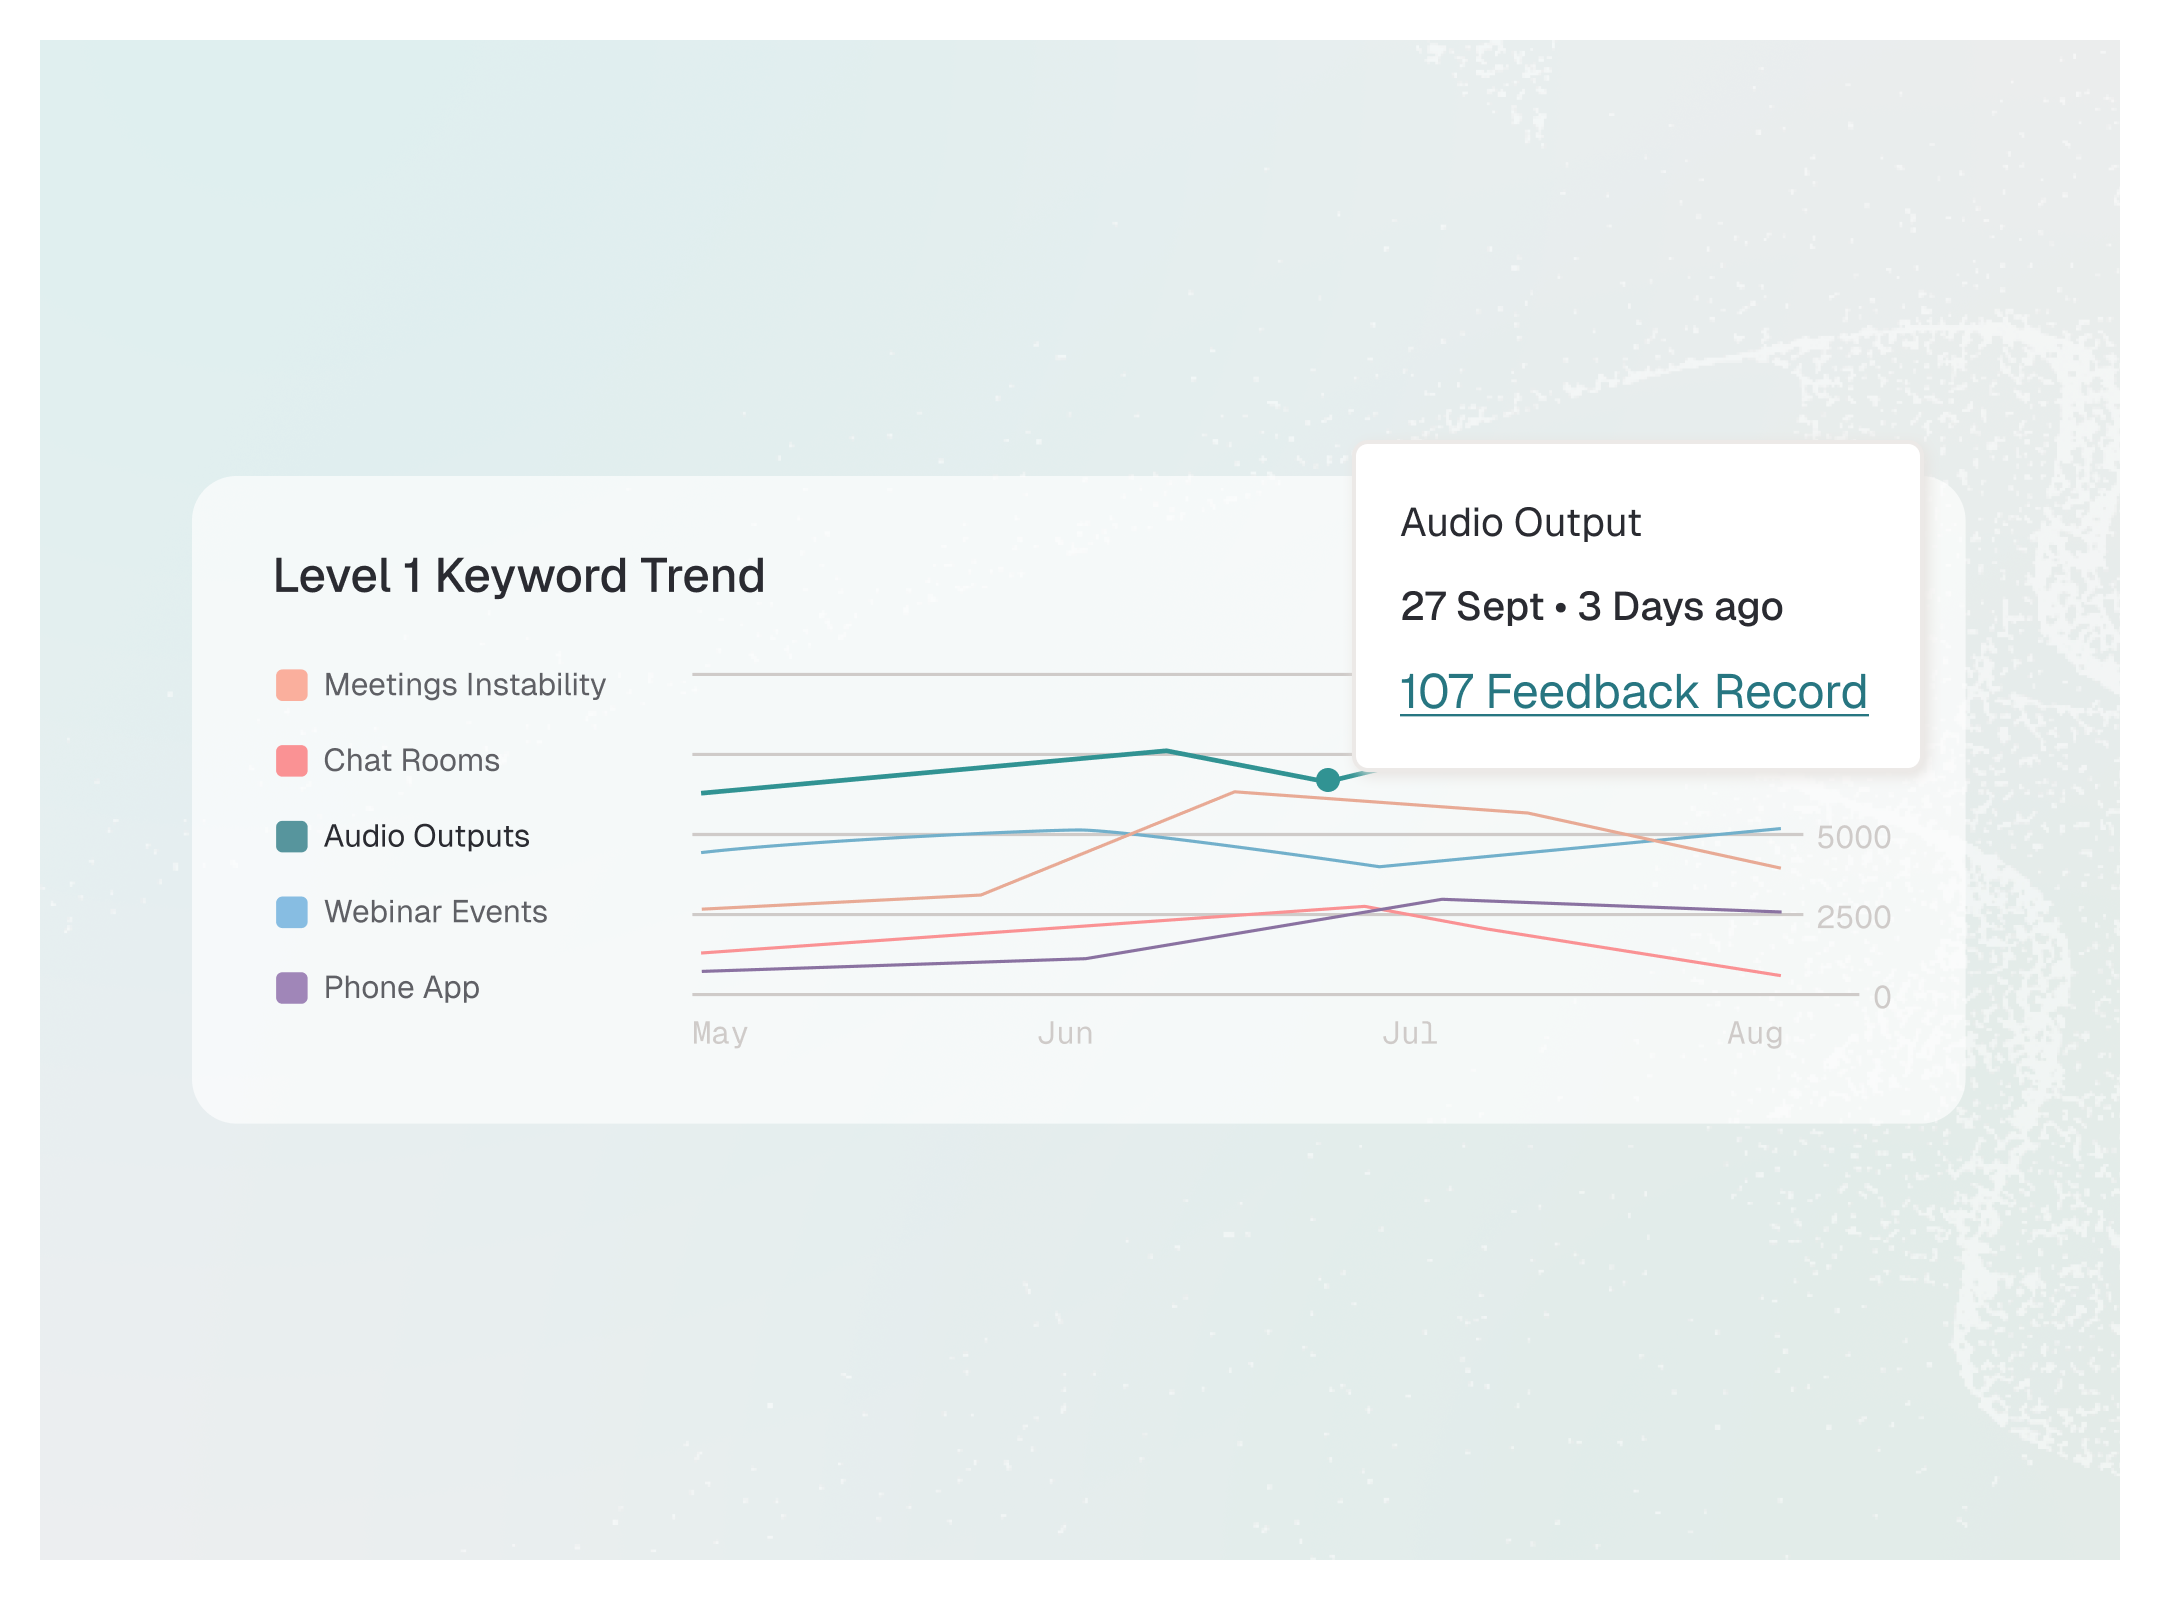
Spot shifts the moment they happen. Catch emerging issues and opportunities early

Proactive Alerts

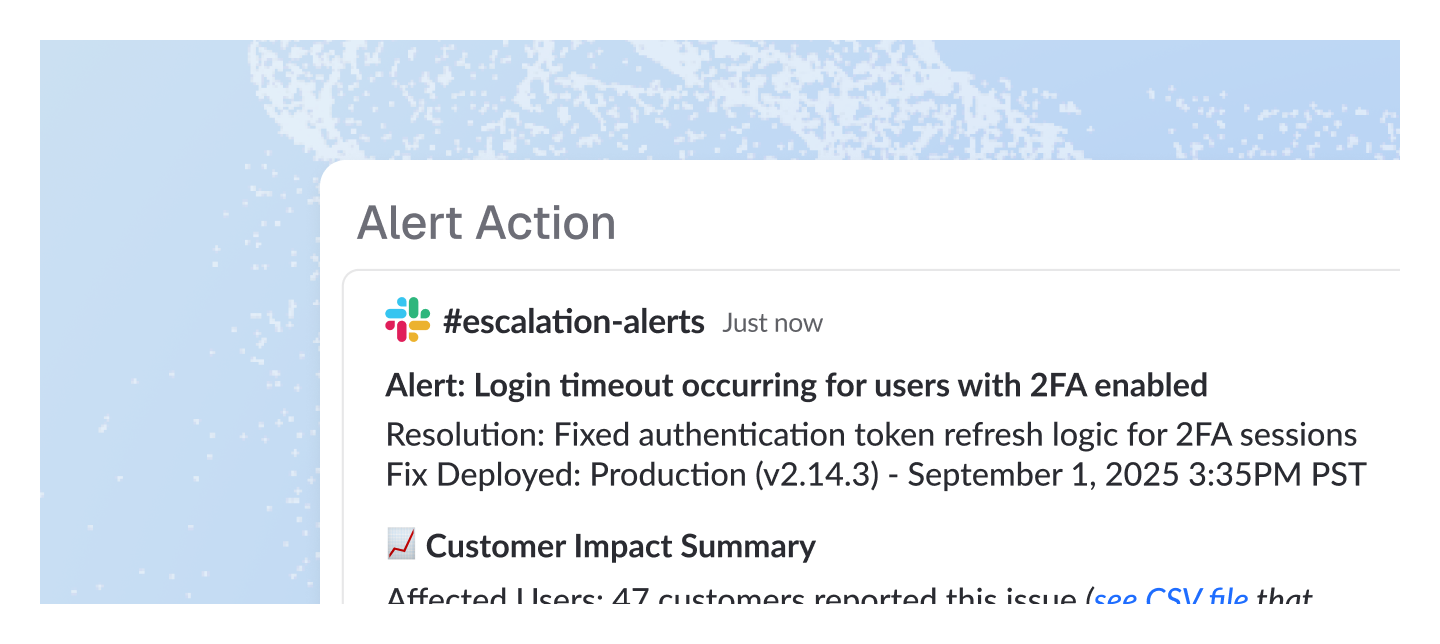
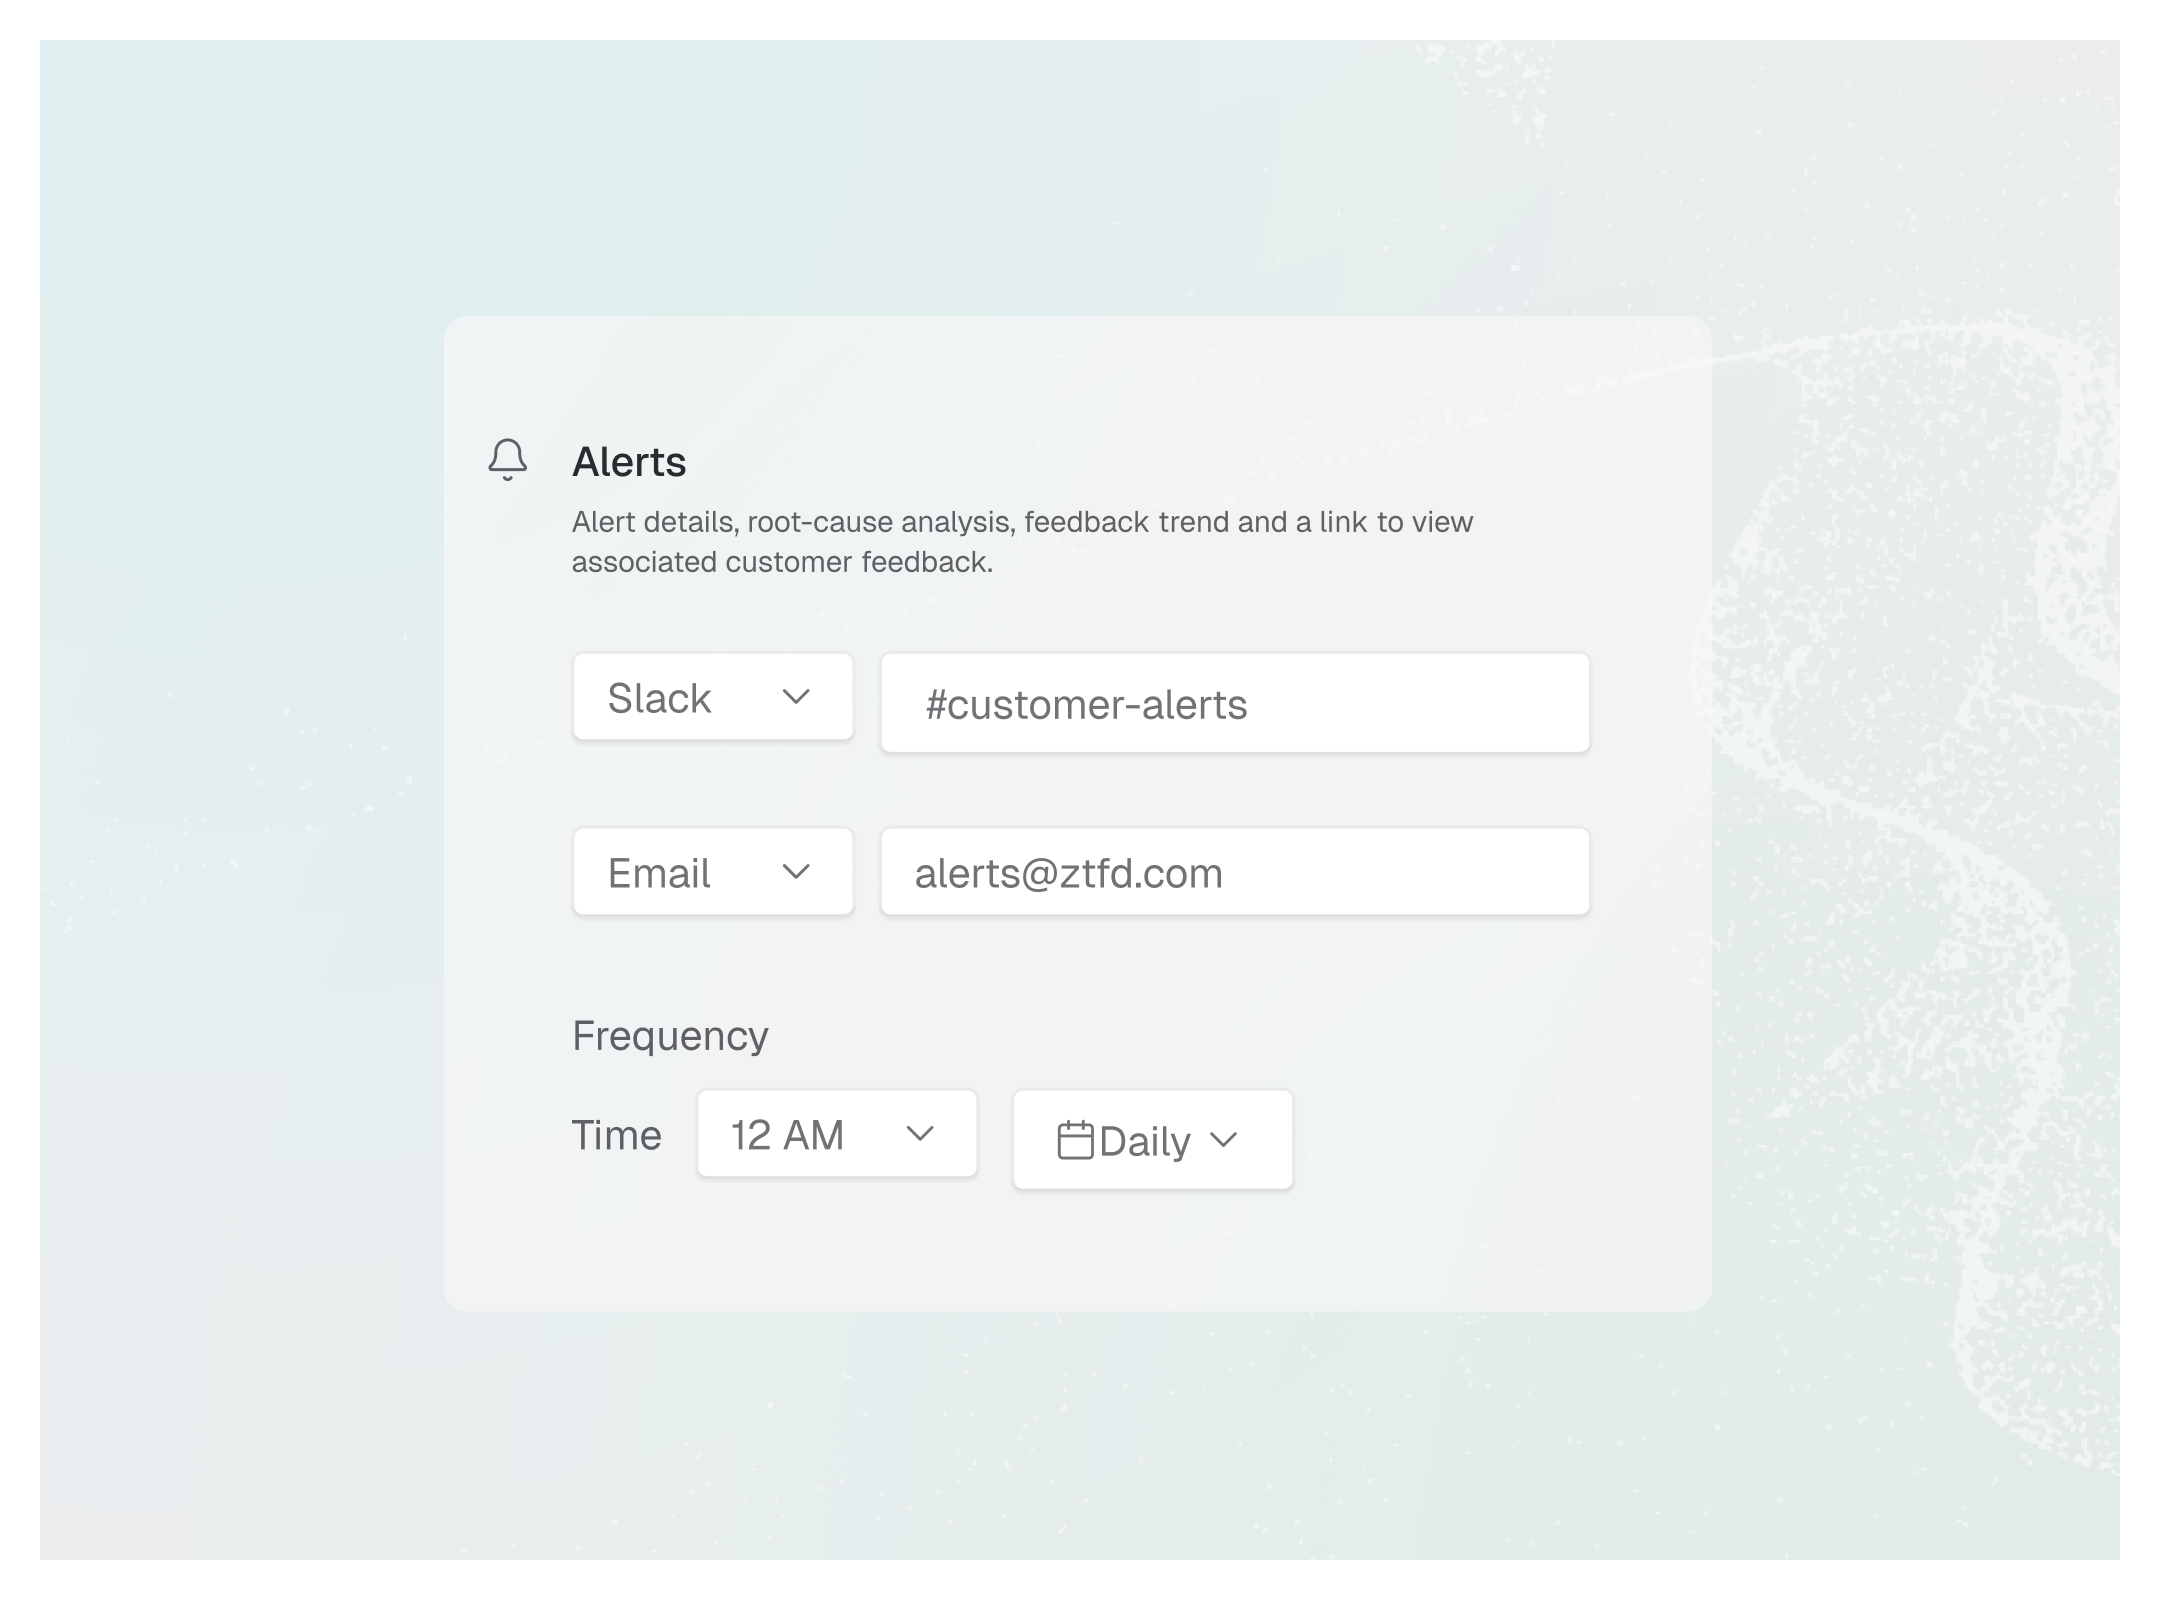
Get notified in Slack or email when anomalies occur. Act fast before they escalate

How Dashboards & Reporting Work

From scattered feedback to strategic clarity, transform noise into actionable intelligence

01
Start Fast with Templates or a QuestioN

Pick a VoC template for Product, CX, or Leadership or build from an existing/new Quantify. Set scope filtering by product, segment, and timeframe.

02
Quantify BY BUsINESS Impact, Not Just Volume

Create impact-weighted charts ranking themes by revenue, CSAT, and NPS. Apply dashboard-level filters using entities and metadata from your Knowledge Graph to surface the signals that move the business.

03
Detect Shifts Before They Scale

Let AI monitor patterns 24/7. Anomaly detection flags significant changes instantly, while Wisdom AI provides natural language answers to any question about your data.

04
Drill from Trend to Truth in One Click

Jump from any chart to Feed. Toggle between verbatim feedback or AI Summary, compare cohorts, and use embedded Wisdom to explain the “why” with grounded answers.

05
Broadcast and Scale the Insight

Schedule automated reports to Slack or email. Share interactive dashboards with one-click access from trends to verbatim feedback, ensuring every team acts on the same customer truth.

use cases

Save time and stop manually tagging feedback.

Create flexible, extensible objects—like Agents, Employees, Stores, Personas, or Campaigns—to model exact context for sharper intelligence.

TRADITIONAL

Infrequent snapshots of only the loudest customers

Customer experience

Infrequent snapshots of only the loudest customers

Voice of customer

Infrequent snapshots of only the loudest customers

Voice of customer

Infrequent snapshots of only the loudest customers

TRADITIONAL

Infrequent snapshots of only the loudest customers

Customer experience

Infrequent snapshots of only the loudest customers

Voice of customer

Infrequent snapshots of only the loudest customers

use cases

Key Benefits

Create flexible, extensible objects—like Agents, Employees, Stores, Personas, or Campaigns—to model exact context for sharper intelligence.

Rebuild trust at scale

Customers see that their voice directly shaped product decisions.

Rebuild trust at scale

Customers see that their voice directly shaped product decisions.

Rebuild trust at scale

Customers see that their voice directly shaped product decisions.

Rebuild trust at scale

Customers see that their voice directly shaped product decisions.

How Close the Loop Works

Create flexible, extensible objects—like Agents, Employees, Stores, Personas, or Campaigns—to model exact context for sharper intelligence.

01
Detect resolutions automatically

Track when linked Jira or Linear issues are marked complete.

02
Aggregate context instantly

Track when linked Jira or Linear issues are marked complete.

03
Review & approve with control

Track when linked Jira or Linear issues are marked complete.

04
Deliver at scale

Track when linked Jira or Linear issues are marked complete.

05
Measure the impact

Track when linked Jira or Linear issues are marked complete.

UNIFY

Connect feedback to business reality

We know feedback isn’t mere standalone data. Knowledge Graph connects your feedback data to users, accounts, opportunities, products, and more—unlocking deeper insights previously undiscovered.

See it in action
UNIFY

Build a graph that reflects your unique business

Create flexible, extensible objects—like Agents, Employees, Stores, Personas, or Campaigns—to model exact context for sharper intelligence.

See it in action

Where customer voices flow into product decisions

Bring customer feedback into the tools that power product planning & prioritization

Explore integrations

Start transforming feedback into customer love.

Leading companies like Perplexity, Notion and Strava power customer intelligence with Enterpret.

Book a demo