


Categorize and analyze customer feedback with AI
For when your team resolves 500 tickets a week but nobody can tell you the top 5 reasons customers write in.

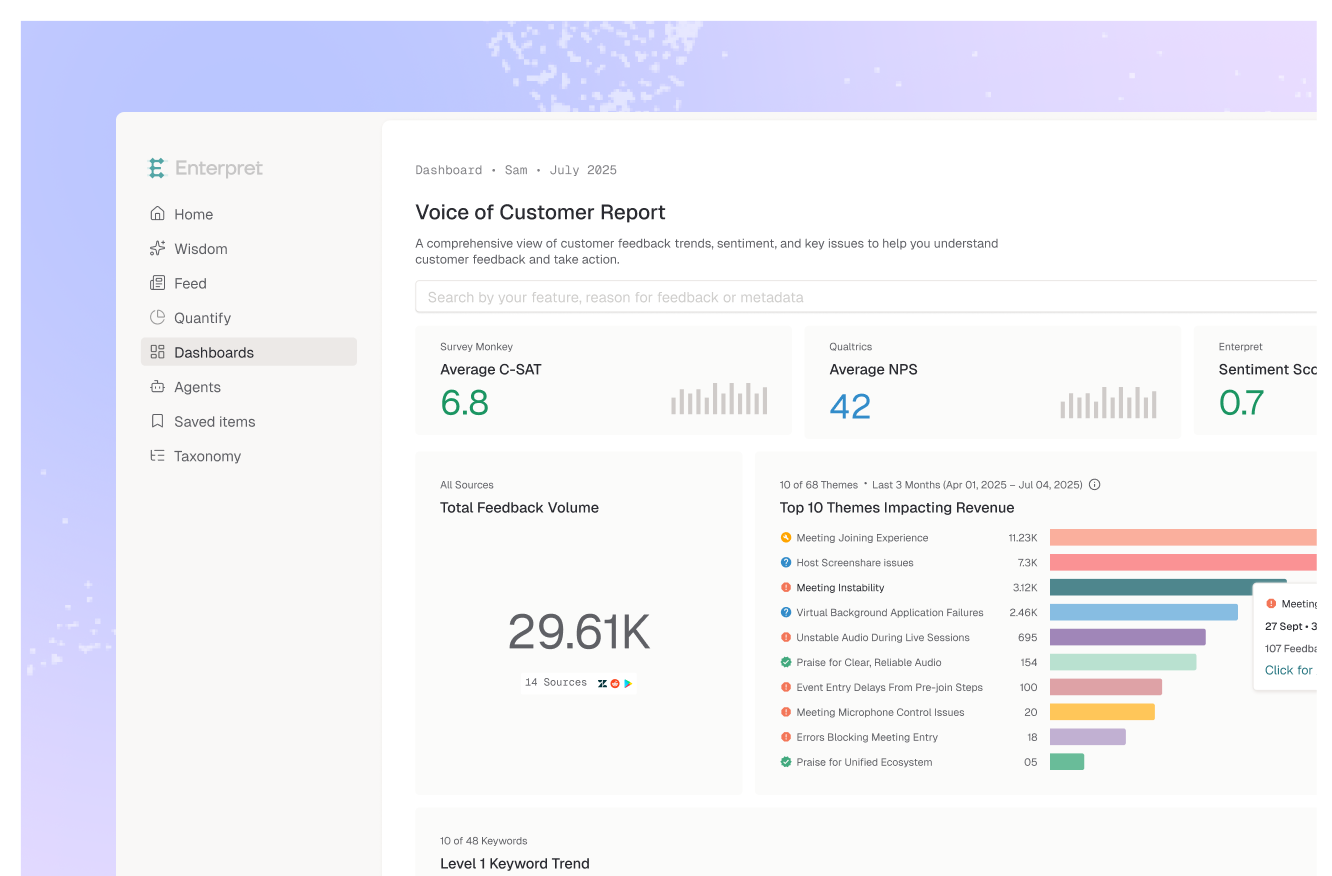
How teams use Enterpret today
Situation
A CX leader was asked "what are customers actually complaining about?" The team had 12,000 tickets from the past month and no way to answer without a manual audit.
Action — asked Enterpret AI
What are the top 10 support themes in the last 30 days, ranked by ticket volume? Show the trend vs. last month.
Impact
Ranked breakdown in under a minute. Discovered "payment processing errors" had jumped 3x in 2 weeks, driven by mobile users. Engineering alerted same day.

Situation
A product team wanted a custom dashboard showing ticket themes by severity with Jira or Linear links — but didn't want to spend hours configuring it manually.
Action — prompted Claude with Enterpret MCP connector
Build me a dashboard showing the top ticket themes ranked by volume, with week-over-week trend and links to related Jira or Linear tickets.
Impact
Claude queried Enterpret via MCP and generated an interactive dashboard with Jira or Linear drill-downs from a single prompt. What would have taken hours was done in 15 minutes.

Situation
After identifying the top complaint themes, the CX team wanted to ensure engineering tracked each one — with the full customer evidence attached to the ticket.
Action — linked feedback themes to Jira or Linear work items
Linked the top 3 spiking themes directly to Jira or Linear issues from Enterpret. Each ticket automatically received the feedback count, customer quotes, and backlinks to the original feedback records.
Impact
Engineering saw exactly how many customers were affected and could read their exact words. No more "support says it's bad" — the ticket had the evidence built in.

.webp)

