Benchmark support quality across teams and agents
For when you manage multiple support teams and need to find where quality slips.
Customer Workflow Examples
Head of Support
PLG SaaS
Situation
Head of Support had 50+ agents across multiple tiers. No way to spot who needed coaching without manually reading tickets. CSAT data was too sparse to be useful
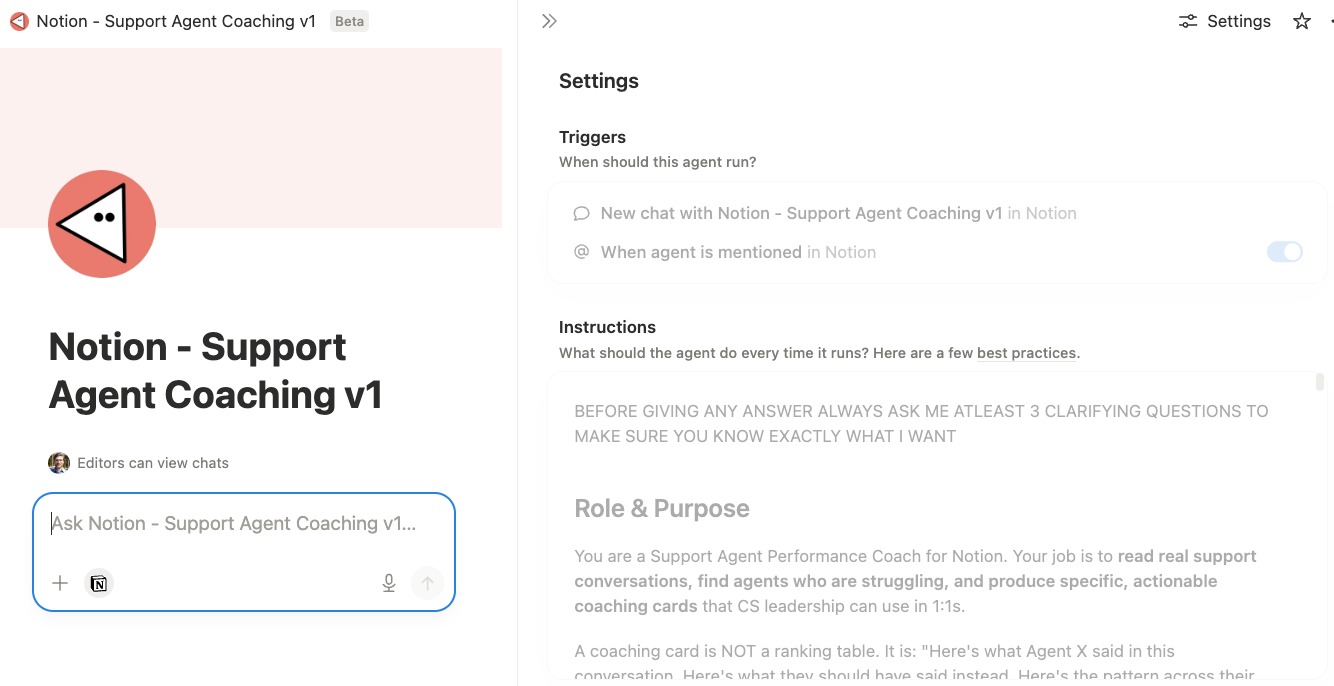
Action — built Notion Custom Agent with Enterpret MCP connector
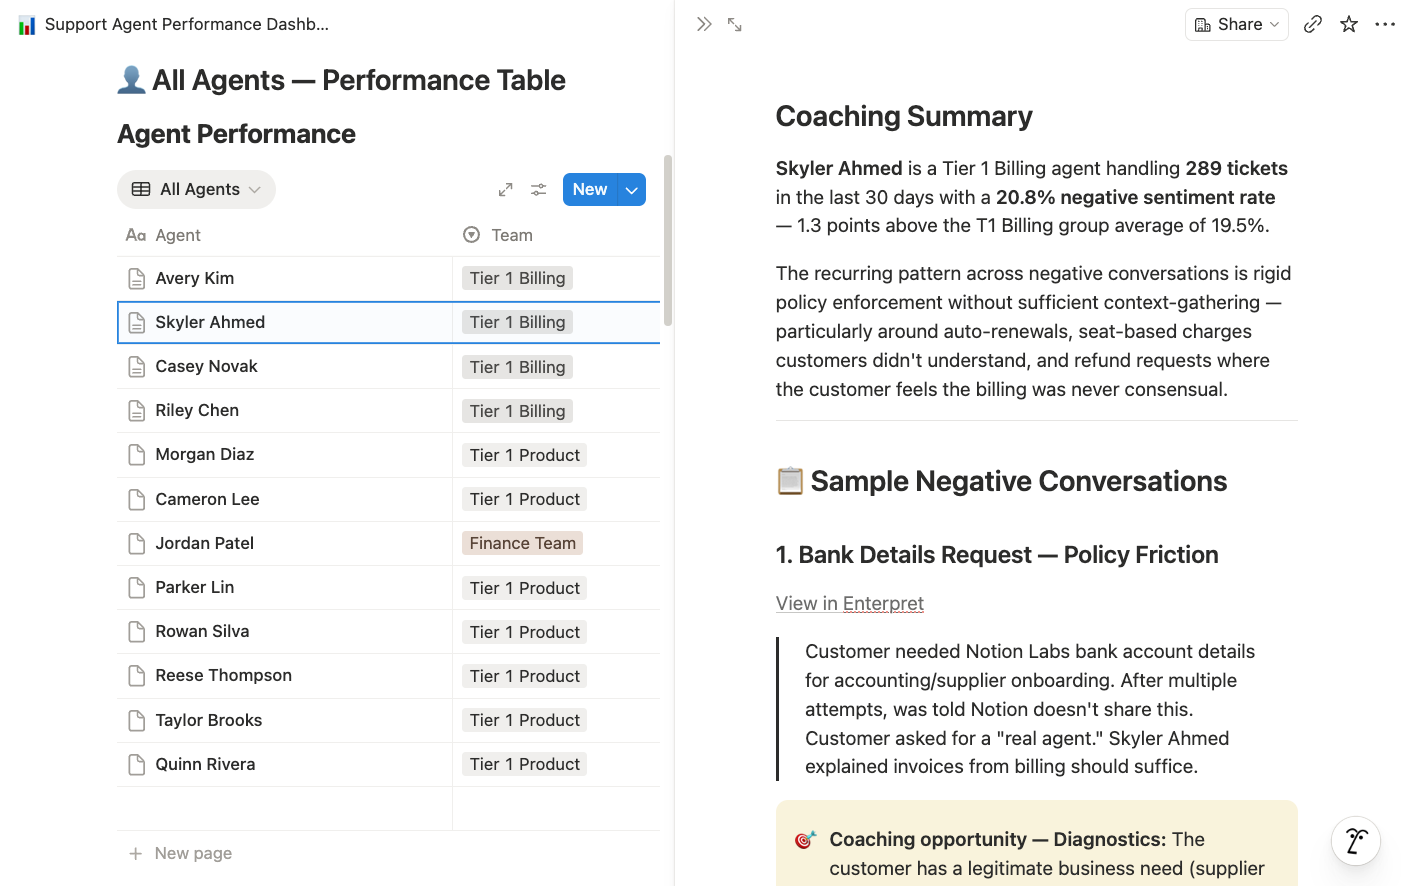
Build a Notion Custom Agent to read real support conversations, find agents who are struggling, and produce specific, actionable coaching cards
Impact
Fully automated coaching pipeline. Agent identifies targets, reads conversations, scores against a 5-point rubric, and writes coaching cards — with direct quotes, realistic rewrites, and a note on whether the issue is the agent's behavior or a systemic gap. Manager walks into the 1:1 with the evidence already pulled. Zero manual ticket review.
Director of Support
Consumer Internet
Situation
A support director needed ongoing visibility into quality differences across tiers — not just a one-time analysis, but continuous monitoring.
Action — configured Quality Monitor agents per support tier
Quality Monitor agents for each support tier compare complaint themes and escalation rates weekly — alert #support-leadership when any tier's quality metrics deviate from the benchmark.
Impact
Weekly comparison revealed Tier 2 agents had 2x the "didn't understand my issue" complaints as Tier 1. Targeted coaching plan created to reduce the gap.
.png)
Director of Support Ops
Hospitality Tech
Situation
After the benchmarking analysis, the team wanted an ongoing view to track whether training investments were improving quality.
Action - prompted Claude with Enterpret MCP connector
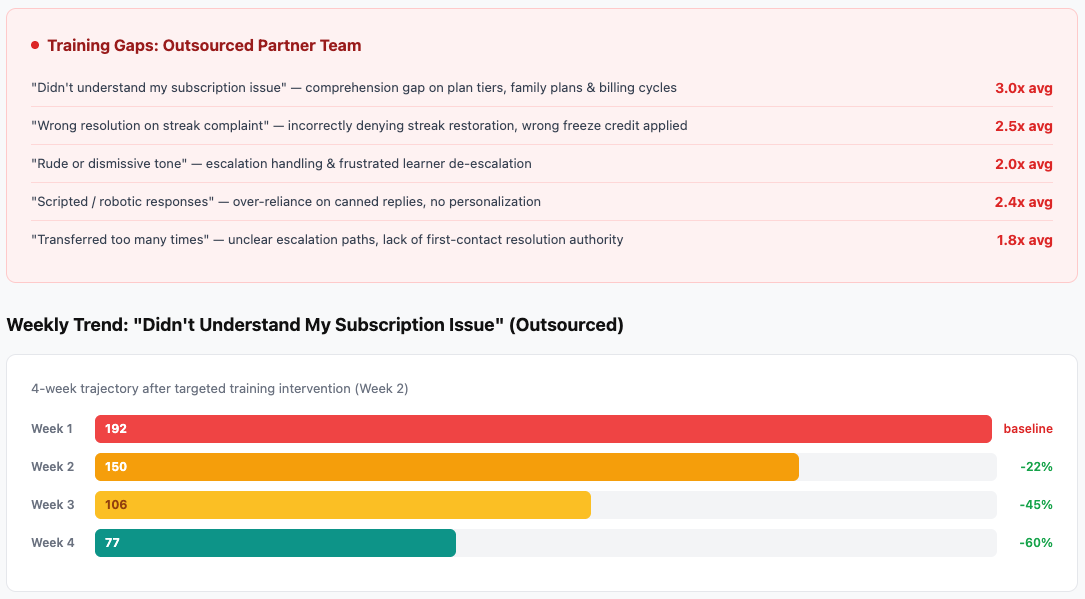
Build a comparison dashboard: negative feedback themes by support tier, trended weekly. Highlight any tier where a theme is 2x above average.
Impact
Created a live quality dashboard that showed training impact within 3 weeks — outsourced "didn't understand" complaints dropped 40%.