



The 8 Signals to Measure Product Area Health From Customer Feedback

Product
November 3, 2026

Product ops should track 10 KPIs for customer feedback, in two layers. Seven measure program health: channel coverage, categorization rate, taxonomy freshness, count consistency, time to insight, PM self-serve rate, and loop-closure rate. Three measure outcomes: revenue-weighted theme alignment, theme trend after launch, and request-to-ship cycle time. The first layer tells you whether the feedback system works. The second tells you whether it changes what the company builds.
The data says most teams are not measuring either. In the State of Product Ops Report 2025, 58% of product ops functions named customer feedback aggregation and prioritization a core responsibility. Yet 21% had no formal method for evaluating their function at all, and the most common metric among those that did was product team satisfaction (54%).
A satisfaction score measures how PMs feel about product ops, not whether the feedback system produces complete, current, repeatable answers. A team can score well while being the bottleneck for every "what are customers saying?" question.
If every feedback question routes through one analyst, throughput caps at that analyst's calendar. More dashboards do not fix that.
Measure the system, not the service desk. Program-health KPIs are leading indicators of whether teams can answer their own questions. Outcome KPIs are lagging indicators of whether those answers changed the roadmap.
One caveat: public benchmarks exist for almost none of these. Sourced numbers are linked; every other target is labeled directional.
Definition: the share of feedback-bearing sources flowing into one analyzable system. Measure: connected sources divided by sources in your inventory (tickets, calls, surveys, reviews, community, CRM notes), weighted by monthly volume. Target (directional): every channel a customer-facing team reads weekly is connected. A missing sales-call channel removes the enterprise voice from every count.
Definition: the share of feedback records mapped to a specific theme. Measure: records with a leaf-level theme divided by total records, excluding "Other" and "General" buckets. Target (directional): a flat or shrinking uncategorized share month over month. A growing "Other" bucket means the taxonomy has fallen behind the product.
Definition: how quickly the taxonomy reflects what you ship, and whether its branches map to teams. Measure: days from a changelog entry to a matching taxonomy node, plus branch leakage (share of records landing in more than one top-level product area). Target: freshness in days, not quarters (directional). For leakage, Enterpret's taxonomy evaluation paper found production reference taxonomies near 20% (19.8% and 19.3%), while AI-generated ones ranged from 34.7% to 76.4%. Treat that as a reference point, not a validated benchmark.
Definition: whether the same question on the same data returns the same themes and counts. Measure: rerun your top-10 themes query on a fixed date window; record the share of themes that changed and the percent difference in counts on matched themes. Target: identical themes and identical counts. Otherwise every downstream KPI inherits the noise.
AI made this KPI urgent. In Enterpret's study of run-to-run instability across eight frontier models, a raw model asked for top themes changed more than half its theme set between two runs at 100 records, and nearly three quarters at 5,000 (churn of 0.552 rising to 0.726). On matched themes, raw models' counts moved 7.5 to 9.8%. The study measured stability, not accuracy, but a number that moves on rerun cannot anchor a roadmap.
0 Volume disagreement for a taxonomy-grounded agent across all 117 valid run pairs, compared with 7.5 to 9.8% count movement for raw frontier models on matched themes. Source: Enterpret Research, "Same Feedback, Different Answer" (arXiv, 2026)
Definition: how long it takes to answer a feedback question with quantified evidence. Measure: median hours from question asked to an answer with volume, segment, and linked records, logged from your intake channel. Target (directional): hours for routine questions, with a shrinking p90. A long tail usually means cross-source questions are the bottleneck.
Definition: the share of feedback questions teams answer without product ops. Measure: self-serve queries divided by self-serve queries plus requests routed to product ops, per month. Target (directional): rising every quarter while your request queue shrinks. This is the KPI that tells you whether you built a system or a help desk.
Definition: the share of customers who asked for something and were told when it shipped. Measure: requesting accounts notified divided by requesting accounts linked to shipped items. Target (directional): as close to every linked account as your tooling allows. If requests are not linked to accounts, you cannot compute it, which is itself the finding. For tooling options, see these tools for closing the customer feedback loop at scale.
Definition: whether the roadmap addresses the themes that carry the most revenue, not just the most mentions. Measure: rank themes by ARR of accounts raising them, then compute the share of committed roadmap items mapped to a top-10 revenue-weighted theme. Target (directional): a majority, with every exception explained.
Definition: whether the problem a launch targeted actually declined. Measure: the theme's share of total feedback and its negative sentiment share at 30, 60, and 90 days post-launch, compared with a pre-launch baseline of equal length. Target (directional): a sustained decline in share. Normalize by total volume so seasonality does not look like a win.
Definition: elapsed time from a customer request to that request shipping and being announced. Measure: Metabase defines it as the median of shipped-and-announced date minus request created date, over requests shipped in the period. Target: Metabase gives no number, noting "quarters, not days, for most B2B roadmaps." Watch the trend and the p90 more than the level.
| # | KPI | Layer | Formula | Healthy direction |
|---|---|---|---|---|
| 1 | Channel coverage | Program health | Connected sources / inventoried sources, volume-weighted | All weekly-read channels connected |
| 2 | Categorization rate | Program health | Records with leaf theme / total records | "Other" share flat or falling |
| 3 | Taxonomy freshness and structure | Program health | Days from changelog to node; branch leakage % | Days, not quarters; leakage low |
| 4 | Count consistency | Program health | Theme and count change on a rerun of the same query | Zero change |
| 5 | Time to insight | Program health | Median hours, question to quantified answer | Falling median and p90 |
| 6 | PM self-serve rate | Program health | Self-serve queries / all feedback questions | Rising quarterly |
| 7 | Loop-closure rate | Program health | Notified requesters / requesters linked to shipped items | Rising toward full coverage |
| 8 | Revenue-weighted theme alignment | Outcome | Roadmap items on top-10 ARR themes / committed items | Majority, exceptions explained |
| 9 | Theme trend after launch | Outcome | Theme share at 30/60/90 days vs. baseline | Sustained decline |
| 10 | Request-to-ship cycle time | Outcome | Median(shipped and announced minus requested) | Falling median and p90 |
Sequence matters. KPIs 1 to 4 are prerequisites: if coverage or consistency is weak, KPIs 8 to 10 are computed on noise. That ordering mirrors the customer feedback maturity model, where structure comes before outcomes.
50+ feedback integrations drive KPI 1, with the caveat that connecting sources and processing history takes time, so coverage ramps rather than flips. Adaptive Taxonomy drives KPIs 2 to 4: it builds an L1/L2/L3 hierarchy (product area, feature, sub-feature) from your docs and changelogs and updates it as you ship. Persistent themes and record-level predictions are the taxonomy-grounded approach the Stability paper measured.
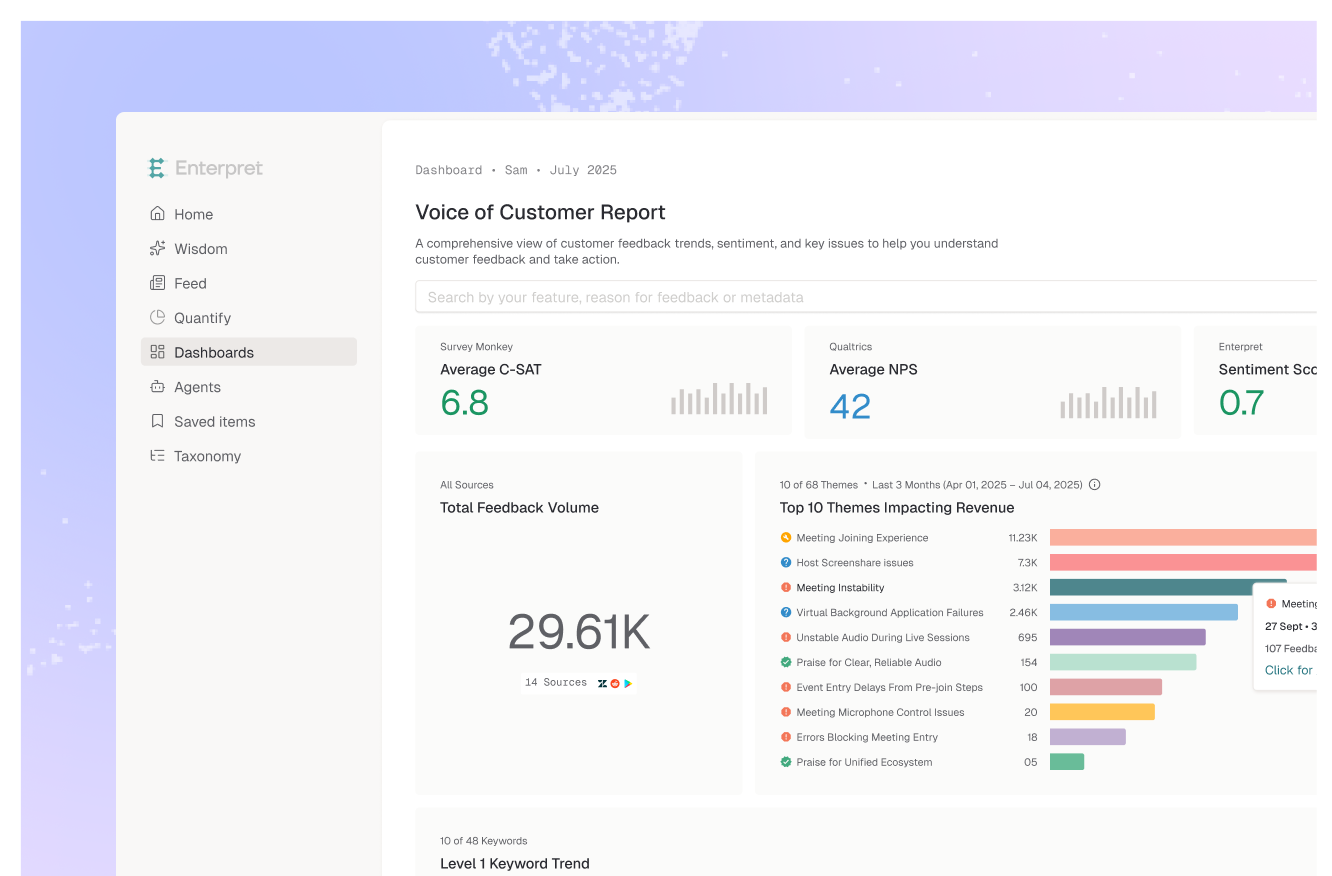
The Customer Context Graph joins feedback to accounts, revenue, tickets, and owners, which is what makes KPIs 7, 8, and 10 computable at all. Wisdom, self-serve feedback views, integrations with Slack, Jira, Linear, and Notion, and the MCP server for Claude, Cursor and other AI assistants move answers into the tools teams already use, which is the lever behind KPIs 5 and 6. AI agents and alerts cover KPI 9 by watching a theme after a launch. If you are comparing platforms on these dimensions, use this guide on how to evaluate a customer insights platform.
Picture a product ops lead at a mid-market SaaS company running this scorecard for the first time. Coverage is 11 of 14 channels, categorization is high, and count consistency passes. But self-serve rate is low and time to insight has a long tail.
The diagnosis is clear: analysis is not the bottleneck, distribution is. The next action is not another dashboard. It is putting quantified answers inside the Slack channels and Jira projects where PMs already work, then rechecking KPI 6 in 30 days. The three missing channels go on next quarter's list, since KPI 8 undercounts until they are in.
That is the point of two layers: the scorecard tells you which layer is broken. As agents answer more feedback questions than analysts do, consistency and self-serve rate will matter more, not less. A system that answers differently each time scales confusion.
PM self-serve rate is the best single indicator, because it shows whether product ops built a system teams use or became the queue every question waits in. Read it alongside coverage and count consistency.
Very few. The State of Product Ops Report 2025 found 21% of product ops functions have no formal evaluation method, so shared benchmarks have not formed yet. Set a baseline in month one and target direction of change.
Because AI analysis can return different themes and counts for the same question. Enterpret's 2026 study found raw frontier models' counts moved 7.5 to 9.8% on matched themes between runs, while a taxonomy-grounded agent showed zero volume disagreement across 117 run pairs. Stability is not accuracy, but unstable counts make every downstream KPI unreliable.
Loop-closure rate measures coverage: what share of requesting customers heard back when their request shipped. Request-to-ship cycle time measures speed: how long the request took to ship and be announced. You need both.
Review program-health KPIs monthly, since coverage gaps and taxonomy drift compound quickly. Review outcome KPIs quarterly with roadmap planning, since launch trends need 30 to 90 days of data.
If you are building this scorecard and want the structure and context underneath it, see how Enterpret works. Run the 10 KPIs for one month, then tell us which one broke first.
Research cited
Lorem ipsum dolor sit amet, consectetur adipiscing elit. Suspendisse varius enim in eros elementum tristique. Duis cursus, mi quis viverra ornare, eros dolor interdum nulla, ut commodo diam libero vitae erat. Aenean faucibus nibh et justo cursus id rutrum lorem imperdiet. Nunc ut sem vitae risus tristique posuere.