



The 10 KPIs Product Ops Should Track for Customer Feedback

Product
November 3, 2026

To connect product usage data with customer feedback, you need three things: a shared identifier on both sides (a user ID or account ID), usage summarized into cohorts or traits rather than raw events, and feedback normalized into a stable taxonomy so it can be counted. Then you join the two, in your warehouse or inside a feedback platform, and audit the match rate before you trust any answer. Here are the seven steps, the questions the join unlocks, and the pitfalls that break it.
Short answer: shared IDs, then cohorts, then a taxonomy, then the join, then a match rate audit. Skip one and the dashboard looks connected but cannot answer "who is complaining, and how much do they use the product?"
Picture a typical SaaS stack: events in Amplitude or Mixpanel, a copy in Snowflake or BigQuery, and feedback scattered across Zendesk, Intercom, Gong, surveys, and app reviews. Usage answers "how many, and in what sequence." Feedback answers "why." Neither answers "is the group that is complaining the group that matters?"
The bottleneck is rarely tooling. It is identity and structure. Analytics tools key on a user ID or anonymous device ID, support tools on an email, surveys on whatever the link carried. And free text cannot be joined to anything until it becomes countable categories.
Usage tells you what happened. Feedback tells you why. The join tells you who it happened to and what it costs. Build it once as infrastructure, not as a quarterly analysis.
Decide whether you join at the user level (one person's complaints against their events) or the account level (a company's feedback against its usage). B2B teams usually need both: user level for feature friction, account level for revenue and renewals. Write down the canonical ID for each, such as your internal user_id and CRM account ID, and which system owns the mapping.
List every system that holds behavior: product analytics (Amplitude, Mixpanel, Heap), adoption tools (Pendo), a CDP (Segment), and the warehouse. Pick one as the source of truth for identity. Usually that is the warehouse, where analytics IDs, CRM accounts, and billing already sit together.
Feedback analysis does not need every click. It needs a few attributes per user or account: plan tier, weekly active days, feature adopted or not, last active date, and cohorts like "power users of reporting" or "trialists who never created a project." Summarizing first keeps the join cheap and readable by a PM who does not write SQL.
The highest-leverage fix is upstream. Pass the logged-in user_id and account ID into your chat widget, survey links, and in-product feedback forms as hidden fields or custom attributes. For channels that only carry an email, like tickets and sales calls, resolve email to user and domain to account through the CRM.
You cannot join a paragraph to a cohort. Each record needs structured labels in a hierarchy (L1 product area, L2 feature, L3 sub-feature) plus sentiment. The labels must stay stable, or "complaints about exports" this month will not mean what it meant last month, and every trend against usage becomes noise.
There are two workable locations, and the right one depends on who needs to ask the questions. The comparison after step 7 covers the trade-offs.
Measure what share of feedback records resolved to a known user or account, by channel. If 90% of chats match but 20% of survey responses do, any survey-driven conclusion rests on a fifth of the data. Publish the match rate next to the insight.
| Dimension | Join in the warehouse | Join in a feedback platform |
|---|---|---|
| Who builds it | Data engineering, with dbt models or similar | Product Ops or an admin, with data team help for identity mapping |
| Feedback structure | You must build and maintain the classification yourself | Taxonomy and tagging handled by the platform |
| Who can ask questions | Analysts who write SQL or use BI | PMs, CX, and Product Ops directly |
| Flexibility on usage data | Full event history, any metric | Usually cohorts and user or account properties |
| Main risk | Taxonomy drift and a queue of ad hoc requests to the data team | Depends on the quality of the identity mapping you feed it |
Many teams use both: the warehouse owns identity and usage summaries, the feedback platform owns classification and everyday questions, and cohorts flow between them. If your feedback already lands in Snowflake, the trade-offs in analyzing customer feedback in Snowflake without a pipeline are worth reading before you commit engineering time.
Once the join exists, these become routine queries:
Feedback from monthly users and daily power users carries different weight.
Compare usage 30 days before and after a complaint. A drop signals churn risk; flat usage suggests a workaround.
Weight each theme by plan tier and account revenue, not just mention count.
Pull feedback from the cohort that abandoned a step to learn why users drop off in your funnel.
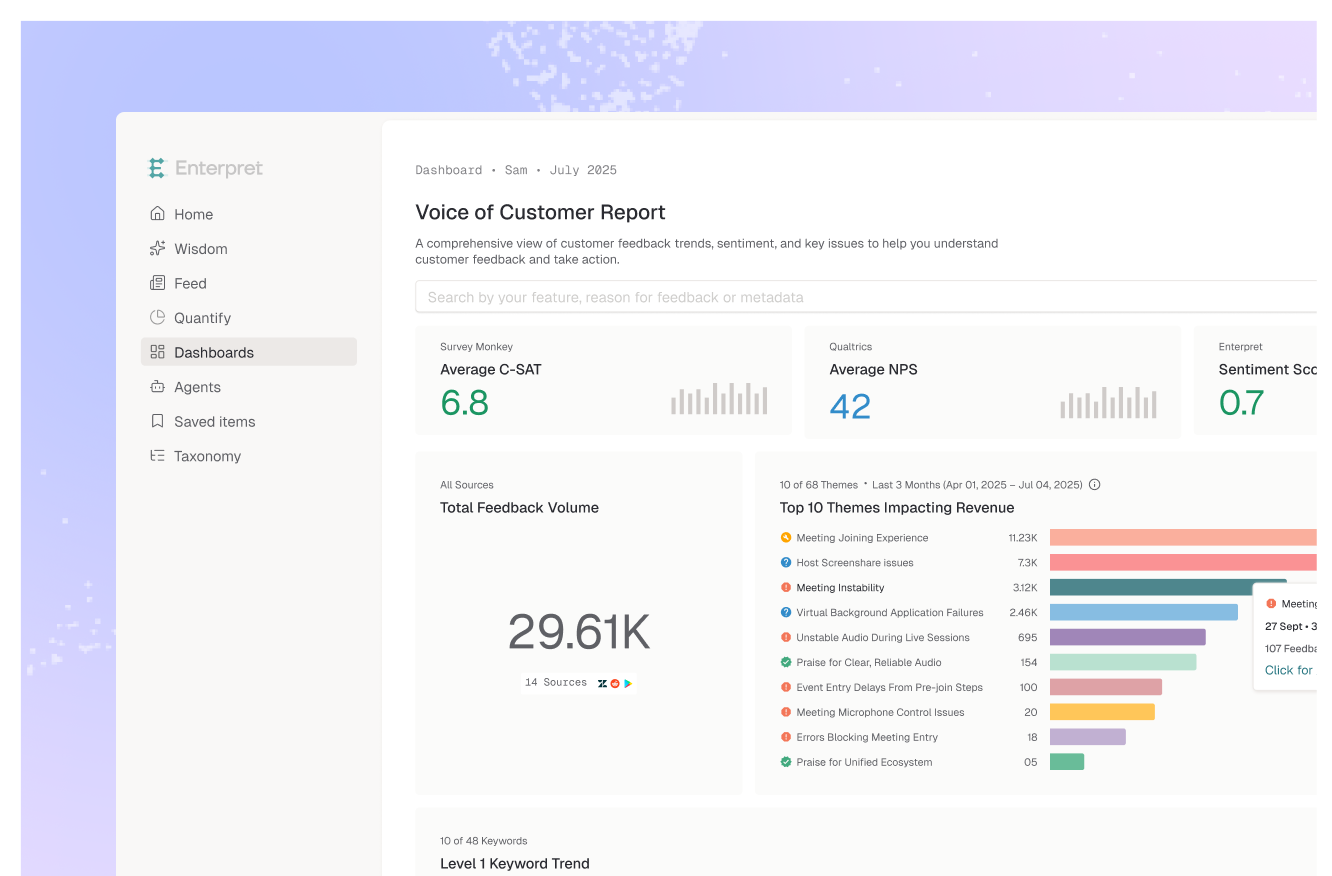
Enterpret handles steps 5 and 6. Adaptive Taxonomy classifies records from 50+ feedback integrations into a product hierarchy built from your docs and changelogs, and the Customer Context Graph joins that feedback to users, accounts, revenue, tickets, and owners. For usage, Enterpret lists cohort-based integrations for Amplitude, Mixpanel, and Segment (slice the taxonomy by cohort, compare cohorts) and a Snowflake integration that imports feedback with user properties and account data. Amplitude's Enterpret destination docs show step 1 in practice: you map an Amplitude field to Enterpret's User ID field before syncing a cohort. For a vendor comparison, see the tools that combine usage data with qualitative feedback.
Joining before anyone asks, rather than at query time, has evidence behind it. Enterpret research comparing Agentic RAG, a Deep Research Agent, and a context graph agent on 30 real VoC questions found that persistent customer context, not more query-time agency, drove the difference.
0.961 vs 0.651 Overall score of an agent grounded in a persistent customer context graph vs Agentic RAG in Enterpret's exploratory benchmark, with the largest gap in analytical depth (0.967 vs 0.642). Source: Enterpret Research, "From Retrieval to Customer Context" (arXiv, 2026)
The caveat: the graph is only as good as the identity data you feed it, and connecting sources and processing history takes time. Plan for an onboarding period.
Picture a Product Ops lead looking at a theme called "scheduled report fails to send." It ranks 14th by volume, 120 records in a quarter, so it never makes the roadmap review. Now join it to usage. Suppose 80% of those records come from the top decile of reporting users, and their weekly report creation falls by a third in the 30 days after their first complaint. The theme did not change; the denominator did, turning a long-tail annoyance into a retention risk. It is also where the work moves up the customer feedback maturity model, from counting mentions to weighting them.
The next permutation is feedback, usage, and revenue in one layer that PMs query from Slack, Jira, or an AI assistant over MCP, instead of filing a request with Product Ops. The bottleneck shifts from "can we join this" to "is our identity mapping clean enough to trust." Run step 7 on your current data and tell us where it breaks.
Use your internal logged-in user ID for user level analysis and your CRM account ID for account level analysis. Email works as a fallback for support and call data, but resolve it to a user ID through your CRM or warehouse.
Join in the warehouse if analysts are the main consumers and you can maintain your own feedback classification. Join in a feedback platform if PMs and CX need to ask questions directly. Many teams do both, syncing cohorts from one to the other.
Do not match it to individual users. Analyze it in aggregate, joined on app version, platform, and date, and compare those trends with usage for the same versions.
It works for a one-off, but retrieval over raw records cannot reliably size a theme. Enterpret's context graph paper notes that "a top-k retrieval result cannot establish corpus prevalence," and in its exploratory benchmark an agent grounded in persistent customer context scored 0.961 versus 0.651 for Agentic RAG.
There is no universal threshold, so report it per channel next to every finding. If a conclusion depends on a channel with a low match rate, treat it as a hypothesis and fix identity capture at the source first.
If you are building this join for your product team, see how Enterpret connects feedback to customer context.
Research cited
Lorem ipsum dolor sit amet, consectetur adipiscing elit. Suspendisse varius enim in eros elementum tristique. Duis cursus, mi quis viverra ornare, eros dolor interdum nulla, ut commodo diam libero vitae erat. Aenean faucibus nibh et justo cursus id rutrum lorem imperdiet. Nunc ut sem vitae risus tristique posuere.