




The 5 Ways DTC Brands Analyze Product Reviews, Support Tickets, and Post-Purchase Surveys Together

November 2, 2026

RICE divides by effort, and effort is measured in person-months. Intercom's original scale gives 0.5 to anything "well under a month." When a coding agent turns that half-month into an afternoon branch, every effort score in the backlog drops toward the floor, and the ranking quietly turns into a sort by Reach times Impact times a Confidence number someone typed in.
RICE is still useful, but only as a shared vocabulary, not as a ranking engine. The 5 ways AI-native product teams prioritize instead are evidence-weighted Reach and Confidence from unified customer feedback (Enterpret), sorting by reversibility before scoring, replacing Effort with the cost of being wrong, buying Confidence with a probe instead of an estimate, and re-checking Kano categories continuously. What separates them from classic RICE, ICE and Kano is that the inputs come from measured customer evidence and shipped experiments, not from a scoring meeting.
Each framework was built for a world where engineering time was the scarce input. That assumption is now false for a large share of well-specified work, and each framework fails in a different place.
The pattern is the same in all three: the framework still works as a set of questions, but the scarce input has moved from "can we build it" to "do we know it matters, and can we undo it if we are wrong."
The real differentiator is the first one. Every framework already multiplies by Reach. Teams that measure it from unified feedback rank differently from teams that estimate it in a meeting.
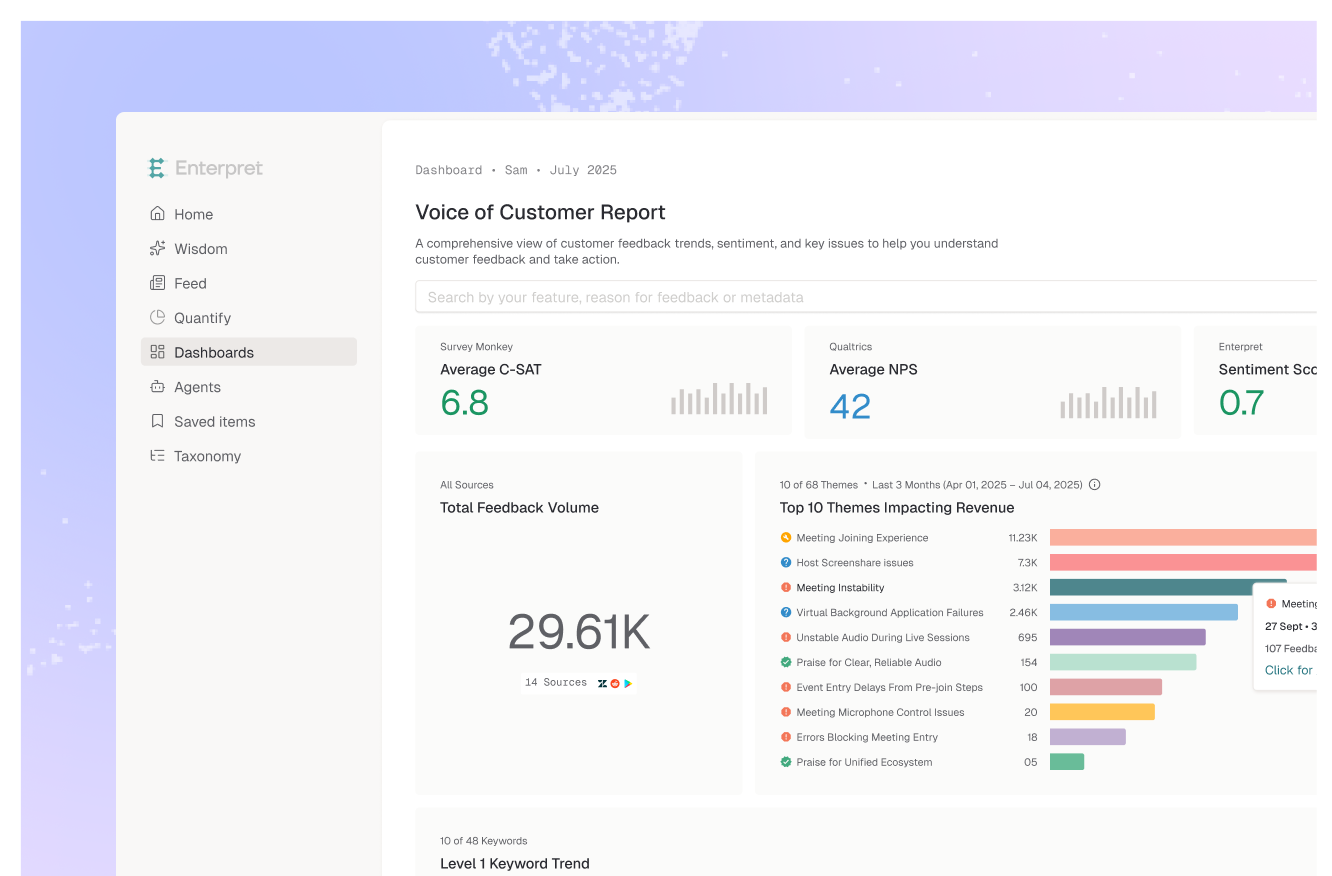
Enterpret replaces the two guessed inputs with measured ones. It unifies feedback from 50+ sources, including Zendesk, Intercom, Gong, Qualtrics, G2 and app store reviews, and categorizes it with Adaptive Taxonomy, a multi-level taxonomy learned from the feedback itself and editable by your team. Because categorization stays consistent over time, a Reach count this month is comparable to last month's. In Enterpret's study of run-to-run instability, a taxonomy-grounded agent reported the same count for a theme across all 117 valid run pairs, while raw frontier models' counts moved 7.5 to 9.8% on matched themes. The Customer Context Graph links each theme to accounts, segments and ARR, so Impact can be weighted by who is asking, not how loudly.
Confidence becomes a citation count instead of a percentage. Through the Enterpret MCP server, a PM can ask Claude or ChatGPT to score a backlog item and get cited answers from real feedback, which is the input that a RICE Claude Skill needs to stay honest. The caveat: Enterpret measures demand. It does not estimate effort, strategic fit or technical risk, and setup requires connecting integrations and processing time before the counts are useful.
Best for: product teams with feedback spread across support, sales and survey tools who want Reach, Impact and Confidence tied to evidence and revenue.
AI-native teams split the backlog into two lanes before any scoring happens. Reversible bets (a UI change behind a flag, a new prompt, an internal tool) skip the scoring meeting and ship as experiments. Irreversible bets (schema changes, pricing, anything a customer will build on top of) get the full evidence review. The tradeoff is discipline: teams have to be honest about what is actually reversible, because "we can always roll it back" is often untrue once customers depend on a behavior.
Best for: teams whose agents produce more candidate changes than anyone can score one by one.
The denominator does not disappear. It changes meaning. Code generation got cheap, but review time, maintenance, support load, documentation and the attention cost of another surface in the product did not. Teams that keep a denominator use an estimate of what a wrong call costs: how many customers it touches, what it does to support volume, and how hard it is to remove. This is harder to estimate than person-months, which is the honest limit of this method.
Best for: mature products where every shipped feature adds permanent surface area and support burden.
When a prototype costs a day, debating whether Confidence is 50% or 80% costs more than building the thing. AI-native teams ship a thin version to a segment, then measure what customers say about it in tickets, calls and in-app surveys. Confidence moves from an opinion to an observation. The risk is that probes multiply into half-finished features nobody owns, so every probe needs a kill date and a named owner.
Best for: new product areas where no historical feedback exists yet.
Kano is still the clearest way to ask whether a feature is expected or delightful. What changes is cadence. Instead of an annual survey, teams watch feedback for the signal that an attractive feature has become a must-be: complaints that it is missing, comparisons to a competitor that has it, or praise that fades as it becomes standard. The tradeoff is that this needs a continuous feedback feed, which a survey tool alone cannot provide.
Best for: AI products in crowded categories, where competitors copy delighters within a quarter.
Effort was always the most estimable input in RICE. Engineers argue about it, but they argue with real knowledge of the codebase. Reach and Confidence were the weak inputs, filled in by whoever ran the meeting. Intercom's own scale admits this: anything under 50% confidence is labeled a "total moonshot," which means the framework had no way to express "we have not checked."
So the AI shift does not break RICE. It exposes it. With Effort compressed, the score is now almost entirely the inputs teams never measured. That is why the teams getting prioritization right are not swapping in a new acronym. They are fixing the inputs. Our guide on prioritizing when your inputs are all qualitative makes the same point from the other direction: every framework already runs on judgment, so the question is whose judgment and what evidence backs it.
The practical work is turning open-text feedback into numbers a score can use. That means coverage, revenue weight and rate of change, which are the measures in how product managers quantify qualitative feedback. It also means resisting urgency inflation, since a loud escalation can look like high Reach when it is one account. The playbook for that is in prioritizing a roadmap when every request feels urgent.
If your team still wants a RICE score, keep it, and make it consistent. Our post on building a RICE prioritization Claude Skill shows how to encode the rubric so Claude applies the same anchors to every item and refuses high confidence without cited evidence. Pair that with measured Reach and the score becomes something you can defend in a roadmap review.
The open question is ranking the option set itself. A perfectly scored list of the wrong options still gives the wrong answer, which is the focus of the 5 ways to decide what to build next. Our working hypothesis: the teams that win the next two years will treat prioritization as a live query against customer evidence, not a quarterly spreadsheet. Try it on your own backlog and tell us where it breaks.
The decision rule: keep whichever framework your team speaks, but never let a guessed input carry more weight than a measured one.
Yes, as a shared vocabulary for Reach, Impact, Confidence and Effort, but not as a ranking engine. When coding agents compress Effort for well-specified work, the score depends almost entirely on Reach and Confidence. Those inputs need to come from measured customer evidence, or the ranking reflects whoever filled in the spreadsheet.
RICE was developed at Intercom and described by Sean McBride in a 2018 Intercom blog post. It scores total impact per time worked: Reach times Impact times Confidence, divided by Effort in person-months. Impact uses a 3 to 0.25 scale and Confidence uses 100%, 80% or 50%.
RICE and ICE are scoring formulas. RICE adds Reach and divides by Effort, while ICE, which Sean Ellis came up with for growth experiments, multiplies Impact, Confidence and Ease. Kano is a classification model from Noriaki Kano that sorts features by how they affect satisfaction, such as must-be, performance and attractive.
They can apply a rubric consistently, which reduces score drift, but they cannot invent the inputs. Without access to your customer feedback, a model guesses Reach and Confidence the same way a meeting does. Connecting it to cited feedback through an MCP server, and encoding the rubric in a Claude Skill, gives you consistent scores grounded in evidence.
Enterpret unifies feedback from 50+ sources, categorizes it with Adaptive Taxonomy, and links each theme to accounts, segments and ARR through the Customer Context Graph. That turns Reach, Impact and Confidence into measured, cited numbers. Teams can query it from Claude or ChatGPT through the Enterpret MCP server while they score.
If your prioritization inputs are still guesses, see how Enterpret for product teams turns customer feedback into evidence you can rank by.
Research cited
Lorem ipsum dolor sit amet, consectetur adipiscing elit. Suspendisse varius enim in eros elementum tristique. Duis cursus, mi quis viverra ornare, eros dolor interdum nulla, ut commodo diam libero vitae erat. Aenean faucibus nibh et justo cursus id rutrum lorem imperdiet. Nunc ut sem vitae risus tristique posuere.