





The 7 Steps to Analyze Product Reviews From UK Retailers Like Argos and Very

Feedback Analysis
November 5, 2026

Picture a hypothetical pair of wireless earbuds: 3,800 reviews in a quarter across six retailers. 31 say the left bud stops charging after a firmware update. That is your earliest defect signal, scattered across retailer pages your quality team does not read.
To detect product defects and quality issues from retailer reviews, follow seven steps: pull reviews for every SKU across retailers, categorize complaints by component, separate defects from expectation and delivery complaints, watch for spikes by SKU, batch window and firmware version, cross-check with support tickets and returns, route to engineering with the exact reviews, and verify the fix by watching the theme decline.
Short answer: star ratings say something is wrong. Component-level themes, sliced by SKU and firmware and backed by exact reviews, say what, where and since when.
Consumer electronics and appliance customers rarely tell the brand. They tell the retailer, on a page you do not own, often weeks before a warranty claim or a return. Three things slow quality teams down:
The shift: treat retailer reviews as field-failure data, not a marketing metric. The unit of analysis is the component, the SKU and the version, with evidence attached.
Coverage is the first bottleneck. A defect that hits one colorway or regional model will not show up if you only watch the flagship listing. Map every SKU to every retailer page and pull new reviews into one place. If you build this yourself, budget for maintaining scrapers, handling site changes and rate limits, and checking each retailer's terms of use; review those terms and prefer approved or managed routes.
"Hardware issue" is not a category an engineer can act on. Build a taxonomy that mirrors your bill of materials, so every branch has an owner. Tools that turn open-text feedback into measurable insights are a start, but the labels must be specific enough to route.
| Component | Example review language | Typical owner |
|---|---|---|
| Battery | "Drains overnight on standby," "won't hold a charge past 60%" | Power and electrical engineering |
| Screen | "Dead pixels in the corner," "flickers at low brightness" | Display hardware |
| Hinge | "Lid wobbles after two weeks," "cracked near the hinge" | Mechanical engineering |
| Connectivity | "Bluetooth drops every few minutes," "won't stay on Wi-Fi" | RF and wireless |
| Firmware | "Bricked after the update," "app says update failed" | Firmware and embedded software |
Test two properties: are leaf labels informative, and can one team own each branch? Enterpret's taxonomy evaluation paper found that AI-generated taxonomies passed every generic quality check, yet 97.7 to 100% of their leaf names just restated a parent's name.
34.7% to 76.4% Share of records leaking across more than one top-level product area in AI-generated taxonomies, versus about 20% in production references. Leakage means one defect lands in two engineering queues, or neither. Source: Enterpret Research, "From Plausible Hierarchies to Useful Taxonomies" (arXiv, 2026)
Not every negative review is a defect. Split them before you count:
Skip this and courier problems inflate your defect rate, which trains engineering to ignore the dashboard.
Defects usually show up as an existing theme that suddenly concentrates. Extract what customers volunteer (purchase month, firmware version, model variant) and watch each component theme by SKU, batch or purchase window, and firmware version. A hinge complaint rate flat across SKUs is a design trade-off. The same rate tripling on one SKU after one month is a manufacturing signal.
Spike detection needs stable counts. In Enterpret's study of run-to-run instability across eight frontier models, raw models' counts on matched themes moved 7.5 to 9.8% between identical runs, while a taxonomy-grounded agent showed zero volume disagreement across all 117 valid run pairs. Small real spikes hide inside that kind of noise.
A review theme is a hypothesis. Confirm it against support tickets in Zendesk, Intercom or Salesforce, returns notes, and app store reviews for connected devices, the same way DTC brands analyze reviews, tickets, and surveys together. When one theme rises in all three in the same window, the case for an investigation writes itself.
A chart that says "connectivity complaints up 40%" starts a debate. A Jira or Linear ticket with the theme, affected SKUs, firmware versions, trend and the verbatim reviews behind it starts an investigation. Name the owner from the taxonomy branch and send it where engineering already works.
A shipped fix is a hypothesis. Baseline the theme, then track it by SKU and firmware version after release. Look for the theme declining on patched units with no new theme beside it. If it falls only in some countries, check the rollout.
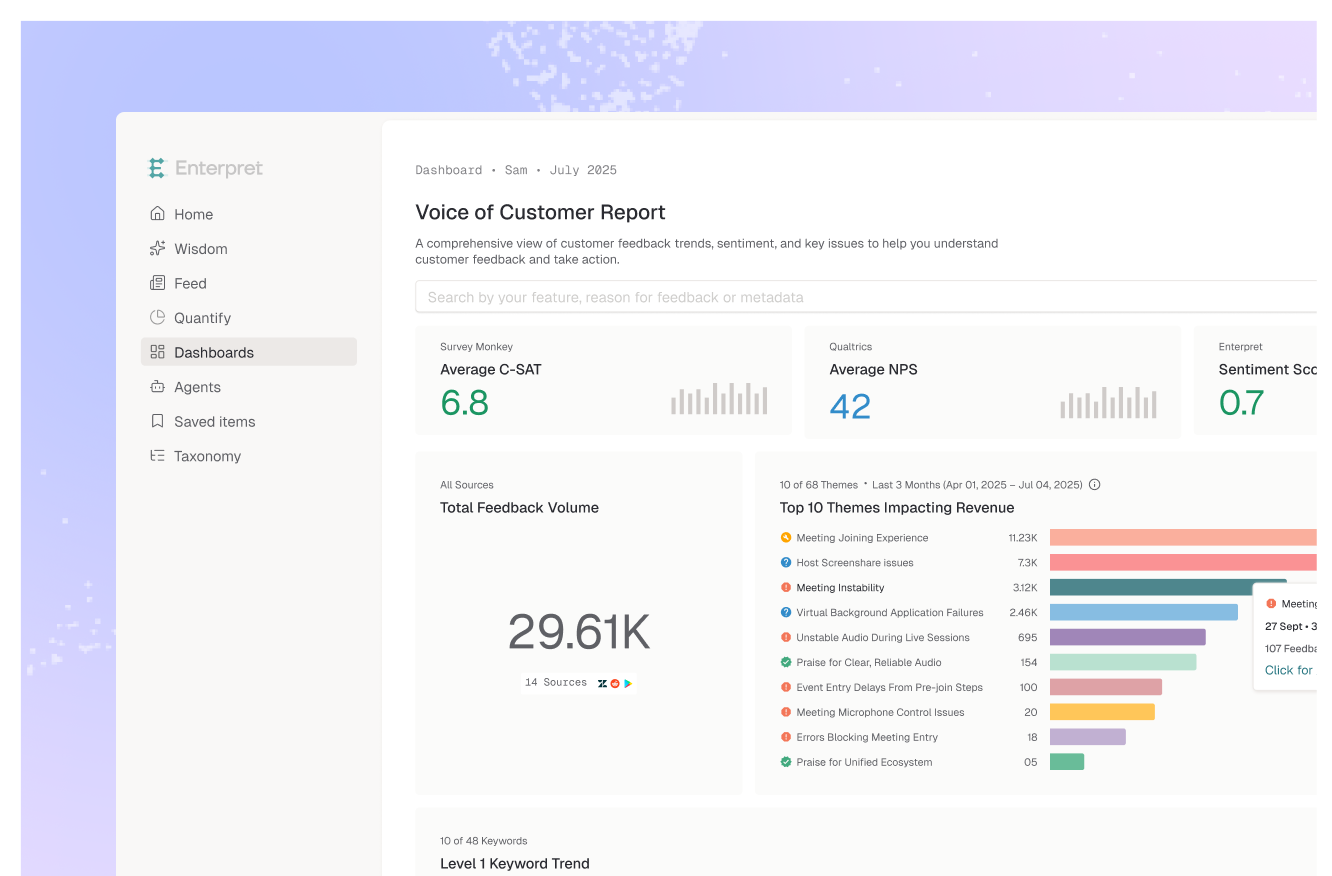
Teams can now bring product reviews from major retailers into Enterpret. Paste product links or product IDs, and Enterpret pulls every new review on that product. Supported retailers include Best Buy (US and Canada), Walmart (US), Argos, Very (including Littlewoods), Orange, MediaMarkt (including Saturn and MediaWorld), JB Hi-Fi and the Meta Store.
The seven steps then map onto one system:
Where it is not the right fit: Enterpret reads what customers say. If your earliest signals live in warranty claims, telematics or line sensors, a manufacturing quality platform covers more. Our comparison of Axion Ray alternatives breaks down which category fits which signal.
Back to the hypothetical earbuds, with illustrative numbers:
What worked: detection in days, not after returns pile up. What did not: the lagging country, visible only because the team sliced the decline by country.
Quality teams already instrument the factory and the field. Retailer reviews are the last unstructured input, and often the earliest. Treat them as a component-level, version-aware signal and the loop from complaint to fix closes in one system. To see where your program sits, use the customer feedback maturity model is a useful benchmark.
Collect reviews for every SKU across every retailer, tag them to a component-level taxonomy, and filter out expectation and delivery complaints. Watch each theme for spikes by SKU, purchase window and firmware version, and confirm against tickets and returns before routing to engineering.
For a one-off read, yes. For ongoing spike detection, consistency matters: in Enterpret's stability study, raw frontier models' counts on matched themes moved 7.5 to 9.8% between identical runs, while a taxonomy-grounded agent had zero volume disagreement across 117 valid run pairs. Unstable counts blur real spikes.
Classify every negative review into defect, expectation gap, or delivery and retail issue. Only the defect bucket, where the product failed to work as designed, should feed engineering metrics.
Major retailers in the US, Canada, UK, Europe and Australia, including Best Buy, Walmart, Argos, MediaMarkt and JB Hi-Fi. Paste product links or IDs and Enterpret pulls every new review.
Baseline the defect theme before the fix, then track it by SKU, firmware version and country. A real fix shows the theme declining on affected units with no new theme replacing it.
If your team is evaluating how to turn retailer reviews into engineering-ready defect signals, see how Enterpret works. Start with one SKU, pull its reviews from every retailer, and tell us where the workflow breaks.
Research cited
Lorem ipsum dolor sit amet, consectetur adipiscing elit. Suspendisse varius enim in eros elementum tristique. Duis cursus, mi quis viverra ornare, eros dolor interdum nulla, ut commodo diam libero vitae erat. Aenean faucibus nibh et justo cursus id rutrum lorem imperdiet. Nunc ut sem vitae risus tristique posuere.


