





The 7 Steps to Analyze Product Reviews From UK Retailers Like Argos and Very

Feedback Analysis
November 5, 2026

410 mentions. 64 accounts. $8.2M in ARR. Those three numbers can describe the same customer theme, and which one you lead with decides whether your business case survives the exec review.
To size a product opportunity using customer feedback, define the theme on a stable taxonomy, count the distinct accounts behind it (not the mentions), weight those accounts by ARR and segment, add pipeline and churn exposure from lost deals and at-risk renewals, triangulate with usage and market data, and express the result as a low, base, and high range with every assumption written down. The seven steps below show the work.
The standard playbooks size from the outside in. Shopify's data guide to opportunity sizing describes three methods: directional T-shirt sizing, bottom-up sizing from comparables, and top-down sizing from market data. It is a good model, and two of its rules carry straight into this article: quantify the estimate "in ranges with an upper and lower bound," and "be conservative in your initial estimates."
What those methods do not cover is the evidence that already sits inside your company: support tickets, sales calls, NPS verbatims, and lost-deal notes, all attached to real accounts with real contract values. For a PM pitching a cross-team opportunity, that is usually the strongest input available, and the one most often presented badly: a mention count and three quotes. The bottleneck is not a lack of feedback. It is that feedback is not joined to accounts, revenue, and pipeline, and volume does not survive the second question.
Market data tells you how big a problem could be. Usage data tells you how often it happens. Customer evidence tells you who is paying you right now and is affected by it. A defensible size uses all three, with customer evidence as the anchor.
"Admin pain" is not sizable. "Admins cannot assign permissions to more than one user at a time" is. Pin the theme to a specific node in a product-area taxonomy (L1 area, L2 capability, L3 issue) and write down what is in and out of scope. If the theme definition shifts between runs, every number downstream shifts with it. Enterpret's study of run-to-run instability across eight frontier models found that raw models' counts moved 7.5 to 9.8% on matched themes between runs, while a taxonomy-grounded agent reported identical volumes across all 117 valid run pairs.
One noisy customer can file 40 tickets. Deduplicate to distinct accounts across every channel (tickets, calls, surveys, reviews, Slack), then report mentions as a secondary intensity signal. Accounts are the unit your exec team budgets in, so that is the unit to size in.
Join each account to its ARR, plan, segment, and lifecycle stage. Twenty enterprise accounts and twenty self-serve accounts are not the same opportunity. Break the total down by segment to see whether the theme is concentrated or broad.
Installed-base ARR is only part of the size. Add open opportunities where the theme came up in sales calls, closed-lost deals that cited it, and upcoming renewals where the account raised it. These come from feature requests and competitor mentions extracted from Gong calls and CRM fields, not from support queues.
Feedback undercounts: most affected users never complain. Check the theme against behavior (how many accounts hit the workaround, the error, or the drop-off) by connecting Amplitude behavioral data with qualitative feedback. Then run a top-down check: how many accounts in your target market look like the ones asking? If the views disagree by an order of magnitude, find out why first.
Exposure is not opportunity. Apply explicit conversion assumptions to each bucket: what share of at-risk ARR the fix would save, how much it would lift win rate on open pipeline, how much expansion it unlocks. Make the low case one you would defend in a hostile room.
Lead with the base case and the range, then show the evidence chain: theme definition, account count, ARR, pipeline, assumptions. Link every number to the records behind it so a skeptical VP can click through. Name the weakest assumption yourself before someone else does.
Picture a B2B SaaS company with a recurring theme: admins cannot bulk-assign permissions. All numbers below are illustrative.
| Input (last 2 quarters) | Accounts | ARR or value |
|---|---|---|
| Raw mentions across tickets, calls, surveys | 410 mentions | n/a |
| Distinct accounts raising the theme | 64 | $8.2M ARR |
| of which enterprise | 22 | $5.3M ARR |
| of which mid-market | 42 | $2.9M ARR |
| Open pipeline where it came up on calls | 9 deals | $1.4M |
| Closed-lost deals citing it | 5 deals | $0.8M |
| Renewals in next 2 quarters raising it | 4 | $0.9M ARR |
Notice the concentration: 34% of the accounts carry 65% of the ARR. That tells you the buyer is the enterprise admin, which shapes scope as much as size.
| Bucket | Assumption (low / base / high) | Low | Base | High |
|---|---|---|---|---|
| Renewal ARR protected ($0.9M) | Fix saves 25% / 50% / 70% | $225K | $450K | $630K |
| Open pipeline won ($1.4M) | Win rate lift 10 / 20 / 30 pts | $140K | $280K | $420K |
| Expansion in affected base ($8.2M) | Uplift 1% / 2.5% / 4% | $82K | $205K | $328K |
| Total annual opportunity | $447K | $935K | $1.38M |
The closed-lost $0.8M is deliberately left out of the total. It is the strongest proof the theme matters, and the weakest proof that those deals come back. Put it in the narrative, not the math. Then the triangulation check: if usage shows 30-plus enterprise accounts running a CSV workaround every week, the 22 who complained are a floor, which argues for the base case over the low one.
Most teams can produce the first row of that table. Few can produce the rest without a week of spreadsheet joins. The failure modes are predictable:
0.961 vs 0.651 Overall score of an agent grounded in a persistent customer context graph vs Agentic RAG on 30 real Voice of Customer questions, in Enterpret's exploratory benchmark. Source: Enterpret Research, "From Retrieval to Customer Context" (arXiv, 2026)
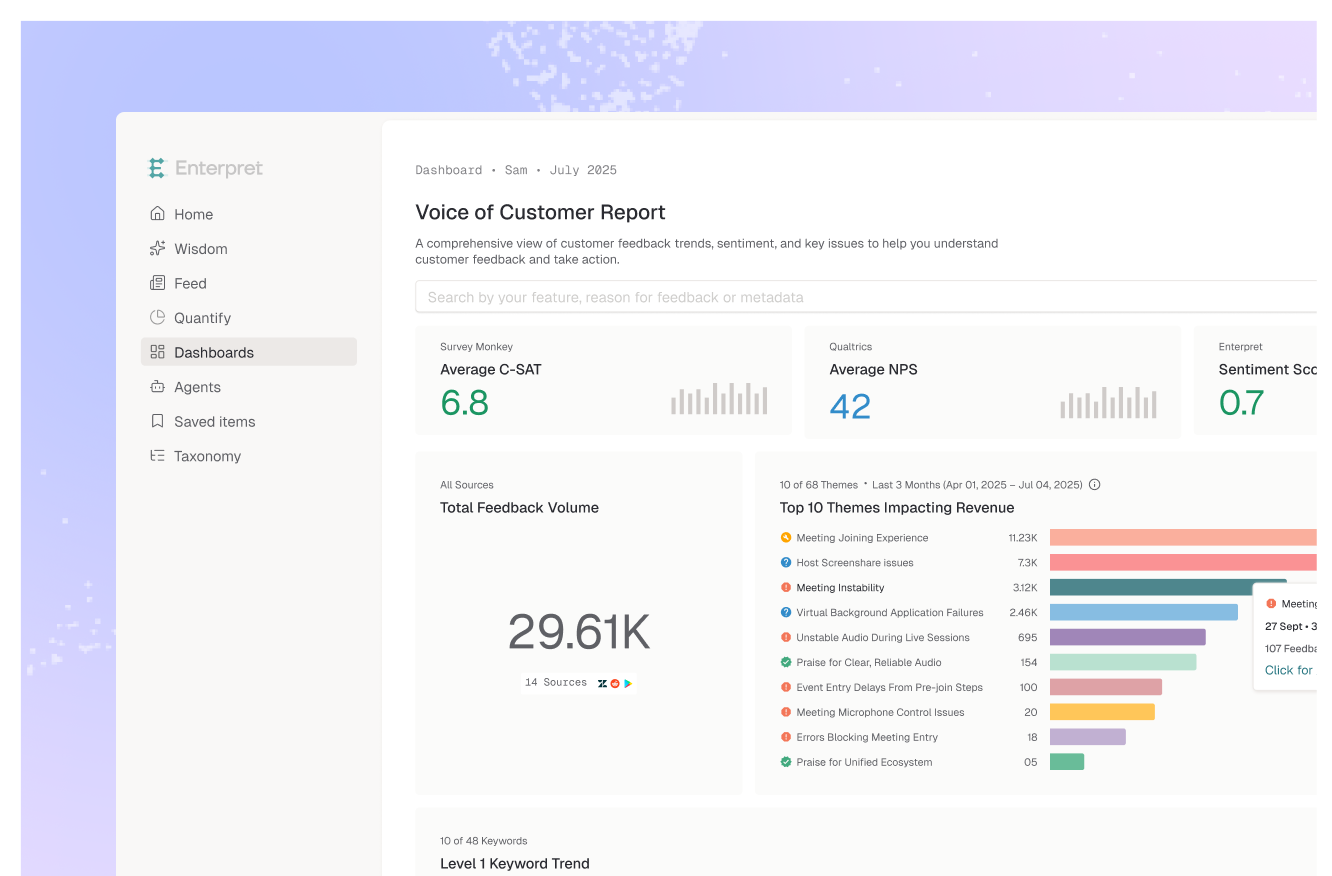
Enterpret is built to turn steps 1 through 4 into a query instead of a project. It connects sources like Zendesk, Intercom, Gong, Zoom, Slack, G2, Salesforce, and HubSpot, then needs integration and processing time to build its model of your customers. After that:
Triangulation (step 5) and conversion assumptions (step 6) remain your judgment. Enterpret gives them a stable evidence base.
The hypothesis: within a couple of planning cycles, "how many accounts and how much ARR?" becomes the default first question in every roadmap review, and mention counts stop appearing in exec decks. Run these seven steps on one theme you are pitching this quarter, and note where your current data breaks. That break is your real bottleneck.
Define the theme on a stable taxonomy, count distinct accounts rather than mentions, and weight them by ARR and segment. Add pipeline and renewal exposure where the theme came up, triangulate with usage and market data, and present a low, base, and high range with explicit assumptions.
Mentions measure how loud a theme is, not how many customers it affects. A handful of accounts can generate most of the volume. Accounts map to ARR and renewals, which is how executives evaluate investment.
You can draft with them, but do not size from raw model output. In Enterpret's stability study, raw frontier models' counts moved 7.5 to 9.8% on matched themes between runs on the same data, while a taxonomy-grounded agent reported identical volumes across all 117 valid run pairs. Stability is not accuracy, but a number that changes on rerun will not survive an exec review.
Usually not in the total. Closed-lost deals citing the theme prove it matters, but rarely come back. Show them beside the range as proof and keep the math to renewals, pipeline, and expansion.
Top-down sizing estimates how large a problem could be across a market. Customer-evidence sizing measures who is affected in your installed base and pipeline today. Use market sizing as a ceiling and sanity check, and customer evidence as the defensible base.
If you are building business cases from customer evidence, see how Enterpret works.
Research cited
Lorem ipsum dolor sit amet, consectetur adipiscing elit. Suspendisse varius enim in eros elementum tristique. Duis cursus, mi quis viverra ornare, eros dolor interdum nulla, ut commodo diam libero vitae erat. Aenean faucibus nibh et justo cursus id rutrum lorem imperdiet. Nunc ut sem vitae risus tristique posuere.


