





The 7 Steps to Analyze Product Reviews From UK Retailers Like Argos and Very

Feedback Analysis
November 5, 2026

You measure your product team's impact on retention and expansion by linking each shipped item to the customer problem it was meant to solve, then tracking that problem and the accounts behind it. Baseline the theme's volume and ARR exposure before launch, watch the theme decline after, and check renewal and expansion outcomes for the accounts that raised it. Then layer usage data on top. NRR and cohort retention tell you whether the business moved. Theme-level tracking tells you which bets plausibly moved it, and how much revenue sat behind each one.
Picture the board slide: NRR up from 104% to 109% over the year, 31 roadmap items shipped. The CEO asks which of the 31 did it. Most product leaders can defend the first number, not the second.
Short answer: measure the problem, not the feature, and report the result as contribution, not proof.
The top answers here come from analytics vendors, and they are good at what they cover. Mixpanel's retention primer walks through usage baselines and behavioral cohorts. BuildBetter's guide covers GRR, NRR and feature keep/kill rules. Both tell you whether retention moved.
The bottleneck is the why. NRR blends pricing, sales motion, CS coverage and budget cycles. Feature-adoption cohorts carry selection bias: adopters were often healthier to begin with. PostHog's guide to feature revenue impact says it directly: without a randomized split, "differences may reflect who was exposed rather than the feature itself."
Stop asking "did the feature move NRR?" Ask "did the problem we targeted shrink, and what happened to the accounts that had it?" The unit of measurement is the customer theme, with its accounts and ARR attached.
Before work starts, link every Jira or Linear epic to the specific theme it addresses, at the feature or sub-feature level ("Reporting > Scheduled exports > Timezone errors"), not "UX improvements." Track untagged platform bets separately so you never claim them.
For each tagged theme, freeze a snapshot over a fixed pre-launch window (90 days works for most B2B teams):
This needs feedback joined to CRM data; here's how to quantify how customer feedback impacts revenue in Salesforce. Reconstructing a baseline after launch invites hindsight bias.
Use the same window, theme definition and normalization after launch. The hidden requirement is repeatable counting: if your counting method drifts 10% between runs, a 10% decline is noise. In Enterpret's study of run-to-run instability across eight frontier models, by Enterpret researchers Viraj Bagal, Raviraja G, and Prabhath Chellingi, raw models' counts on matched themes moved 7.5 to 9.8% between runs on identical data.
0 of 117 Valid run pairs in which a taxonomy-grounded agent reported a different volume for the same theme, vs 7.5 to 9.8% count movement for raw frontier models. Source: Enterpret Research, "Same Feedback, Different Answer" (arXiv, 2026)
Split affected accounts into three cohorts: raised the issue and got the fix before renewal, raised it and renewed while it was still open, and never raised it. Compare gross renewal rate and contraction across the three. This is the same logic as comparing churned vs retained customer feedback, pointed at one theme.
Find the sales calls, CSM notes and opportunities where the theme blocked a seat expansion, tier upgrade or new business unit. After ship, count how many of those opportunities progressed and how much expansion ARR closed. This is often the most persuasive board-deck line: the account told you what was in the way.
Track the share of churn and contraction reasons (exit surveys, cancellation notes, CSM post-mortems) attributed to the theme, before and after. It is lagging and low-volume, but it is the closest retention signal tied to one problem.
Check adoption among the accounts that raised the issue, not the whole base. If theme volume fell but adoption is low, the decline may have another cause. If adoption is high and the theme persists, the fix missed. See these options to connect Amplitude behavioral data with qualitative feedback.
| Metric | Signal type | What it supports |
|---|---|---|
| Theme volume decline | Leading, weeks | The problem shrank |
| Adoption among affected accounts | Leading, weeks | The fix reached the right people |
| Expansion blockers removed | Mid, one to two quarters | Revenue was unblocked |
| Renewals of affected accounts | Lagging, a renewal cycle | Retention held where the risk was |
| Churn reasons that dropped | Lagging, a renewal cycle | The theme stopped costing accounts |
This method gives you defensible contribution, not causation. Four rules keep it honest.
Unless you ran a randomized or staged rollout, say "contributed to," never "caused." A staggered rollout by segment gets you closer to a real comparison.
Pricing changes, a new CSM, a departed champion, a competitor discount. List confounders per account and show those accounts separately.
Fourteen enterprise renewals is an anecdote with a percentage on it. Report counts, and wait a full renewal cycle before calling a retention result.
If you added a channel or redefined the theme mid-period, the before and after are not comparable. In Enterpret research comparing Agentic RAG, a Deep Research Agent, and a context graph agent, the context graph agent declined to claim a reliability trend because the baseline window was not comparable. That restraint is the standard to hold your own reviews to.
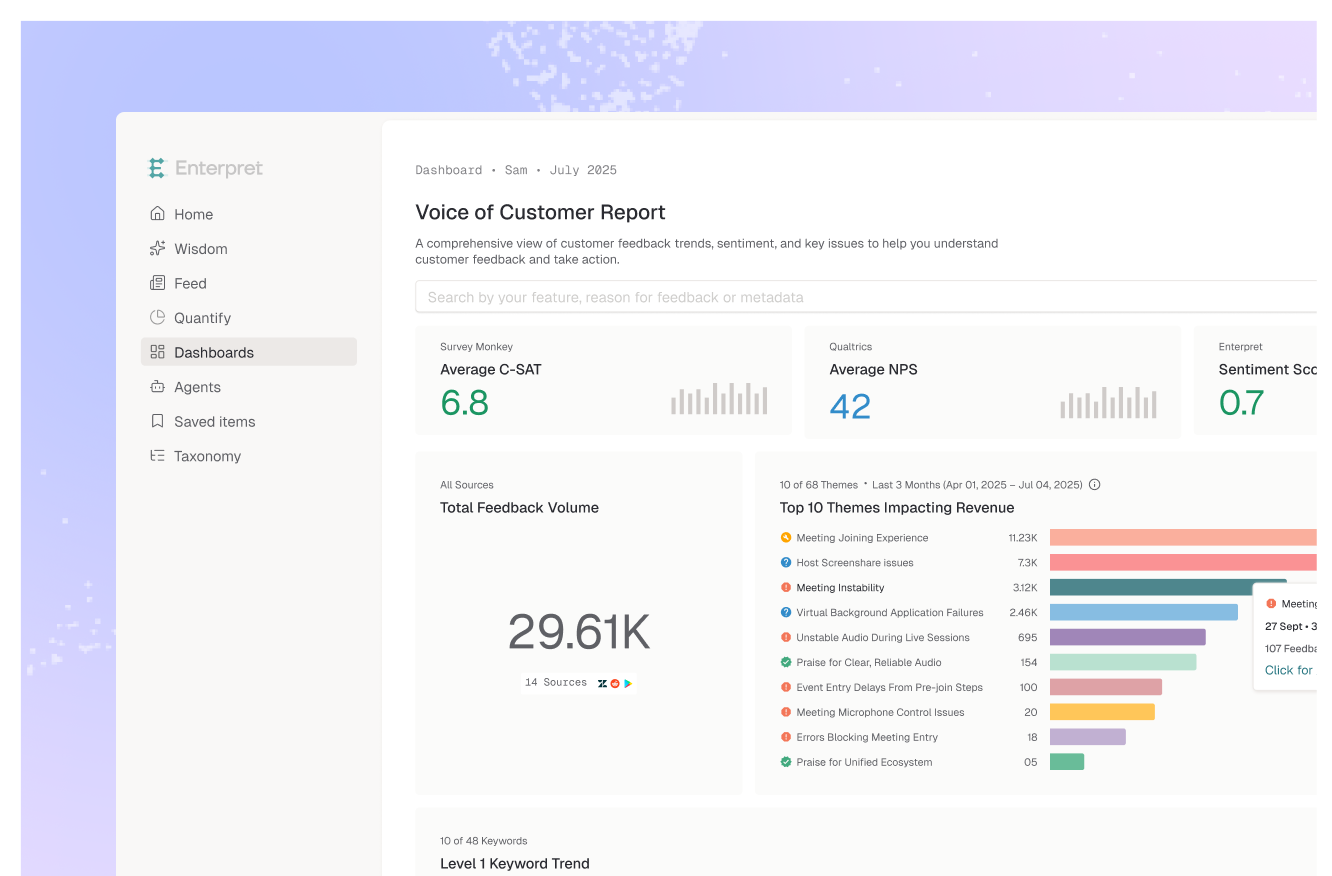
The seven ways are one system: Theme + Account context + Revenue + Usage. Enterpret covers the first three and connects to the fourth.
With 50+ integrations and delivery into Slack, Jira, Linear and Notion, the theme tag can live on the roadmap item. Plan for setup time: integrations connect and the graph needs processing before your first baseline is ready.
Picture a mid-market analytics company that ships a rebuilt scheduled-export engine. Its frozen 90-day baseline: 412 mentions, 63 accounts, $4.1M ARR exposed, 19 renewals due in the next two quarters, and 7 expansion opportunities stalled on the issue.
The readout two quarters later: theme volume down 58%, 17 of 19 renewals held, 3 of 7 blocked expansions closed. Two renewals also got a pricing concession, so they are reported separately. But only 25 of the 63 affected accounts adopted the new scheduler. The bottleneck is no longer the bug. It is the 38 accounts still on the old flow. Next action: an in-app migration prompt for those accounts, not another export feature.
Boards already ask sales for pipeline by source; product will get the same question about retention. The teams that answer well keep a running ledger of theme, accounts, ARR and outcome for every bet, a marker of the later stages in the customer feedback maturity model. Treat the ledger as a hypothesis: run it on one launch from last quarter and see where it breaks.
There is no single metric. Pair a company-level number (GRR or NRR) with theme-level metrics: decline in the targeted theme, renewal rate of the accounts that raised it, and churn reasons that dropped.
Not cleanly, unless you ran a randomized or staged rollout. Pricing, CS coverage and market conditions move NRR too. The honest claim is contribution: the problem shrank, affected accounts renewed or expanded at a higher rate, and confounders are listed.
Theme volume and adoption move within weeks, expansion blockers in one to two quarters. Renewal and churn-reason effects need a full renewal cycle, up to a year on annual contracts.
Only if the counts are repeatable. Enterpret's stability study found raw frontier models' counts on matched themes moved 7.5 to 9.8% between runs on identical data. A taxonomy-grounded agent reported identical volumes across all 117 valid run pairs, which is what a before and after comparison requires.
Four inputs: feedback from every channel (tickets, calls, surveys, reviews), CRM data for ARR, renewal dates and opportunities, your roadmap tool for theme tags, and product analytics for adoption.
If you're building this ledger for your own roadmap, see how Enterpret works.
Research cited
Lorem ipsum dolor sit amet, consectetur adipiscing elit. Suspendisse varius enim in eros elementum tristique. Duis cursus, mi quis viverra ornare, eros dolor interdum nulla, ut commodo diam libero vitae erat. Aenean faucibus nibh et justo cursus id rutrum lorem imperdiet. Nunc ut sem vitae risus tristique posuere.


