




The 10 KPIs Product Ops Should Track for Customer Feedback

Product
November 3, 2026

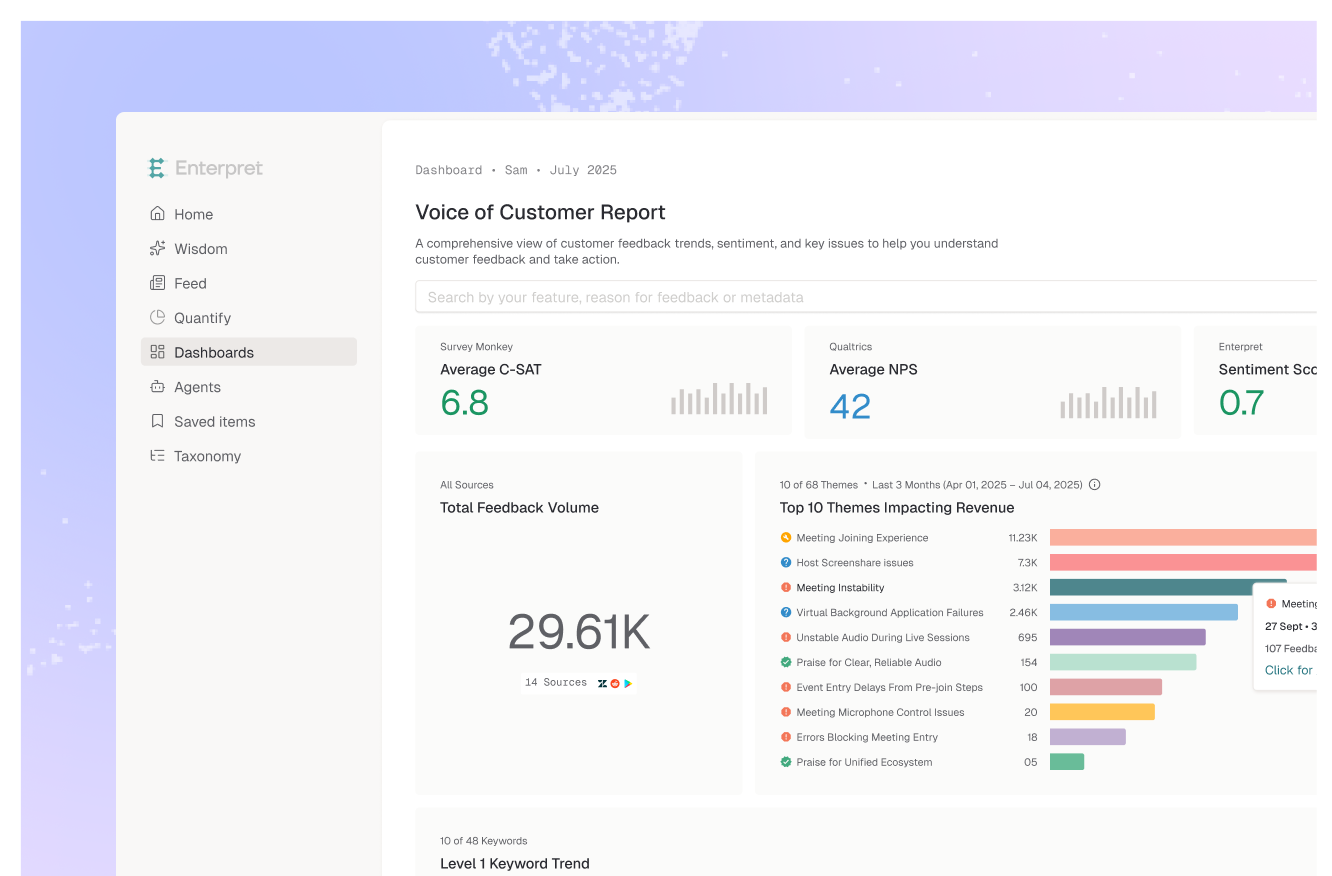
To measure product area health from customer feedback, map every piece of feedback to a stable product area taxonomy (L1 product area, L2 feature, L3 sub-feature), then track eight signals per area: negative share, volume per active user, trend versus baseline, emerging themes, revenue exposure, severity mix, loop closure, and ownership coverage. Roll them into one scorecard per area, review it on a fixed cadence, and route every red cell to a named owner.
Search for "health" and feedback, and almost everything you find is about accounts. Gainsight's own write-up on redesigning its customer health score builds it on Deployment, Engagement, Adoption, and ROI, with NPS and ticket volume as supporting inputs. That model answers one question: which customer needs attention?
Product area health answers a different one: which part of the product is getting worse, for whom, and who owns the fix? The unit of analysis flips from the account to the product area. CS needs the first view, and there are good customer health score tools that use feedback data. Product Ops needs the second, because roadmaps are organized by area, not by account.
Customer health = account x signals. Product area health = product area x signals x segment. Same feedback, different pivot. The second permutation is the one a PM can act on in a sprint.
The typical setup is a sentiment chart and a hand-maintained tag list. It works for a quarter, then tags drift and two failure modes show up.
The second failure is measurable. In Enterpret's taxonomy evaluation paper, researchers Prabhath Chellingi, Raviraja G, and Viraj Bagal found that AI-generated taxonomies passed every generic quality check, yet 34.7% to 76.4% of records leaked across top-level product areas, versus about 20% in production references built with structural checks. A per-area metric on a leaky tree double counts by design.
76.4% Worst-case branch leakage in an AI-generated feedback taxonomy: three of every four records spanned more than one team's product area, versus roughly 20% in production references. Source: Enterpret Research, "From Plausible Hierarchies to Useful Taxonomies" (arXiv, 2026)
Calculate each signal per L1 product area, then drill to L2 and L3 when an area turns yellow or red.
Negative feedback in the area divided by all feedback in the area. It controls for size, so a small area with 40% negative share outranks a large one at 15%.
Feedback mentions per 1,000 weekly active users of that area, pulled from your product analytics. It separates "more people use it" from "more people struggle."
This week's normalized volume and negative share compared with a trailing 8 to 12 week baseline. Health is a direction, not a snapshot. Annotate launches so spikes have causes.
New or fast-growing L3 themes inside the area. Area-level averages hide a single sub-feature breaking, so this is the early-warning signal. It is the same muscle as identifying trending product issues, scoped to one owner.
Total ARR of distinct accounts with negative feedback in the area this period, plus renewals in the next 90 days. This needs feedback joined to CRM data, which is why teams that quantify how customer feedback impacts revenue in Salesforce prioritize faster.
The split between bugs and blockers, usability friction, and feature requests. Equal volume is not equal health if one area is mostly "it's broken."
Share of the area's top themes linked to a Jira or Linear issue, and whether volume on a theme dropped after the fix shipped. An area with rising feedback and zero linked work items is unhealthy regardless of sentiment.
Share of the area's feedback that maps to exactly one owning team. Low coverage means the other seven signals are reported to nobody.
Copy this into a doc or dashboard, one scorecard per L1 area. The flag thresholds are starting hypotheses, not benchmarks. Calibrate them against your own baseline after four to six weeks.
| Signal | How to calculate | Flag when | Owner action |
|---|---|---|---|
| Negative share | Negative records / all records in area | Up 5+ points vs baseline | Drill to L2 and L3 drivers |
| Volume per active user | Mentions / (weekly active users of area / 1,000) | Up 25%+ vs baseline | Check recent releases |
| Trend vs baseline | This period / trailing 8 to 12 week average | Two consecutive periods above 1.2x | Annotate cause or open investigation |
| Emerging themes | New or 2x-growth L3 themes | Any theme with 10+ records | Triage within one week |
| Revenue exposure | ARR of accounts with negative feedback | Includes a renewal within 90 days | Loop in CS owner |
| Severity mix | % bugs and blockers of area total | Bugs exceed requests | Escalate to eng lead |
| Loop closure | % top 5 themes with linked work item | Below 60% | Create or link tickets |
| Ownership coverage | % records mapped to one owning team | Below 80% | Fix taxonomy boundaries |
Rate each signal green, yellow, or red. Skip a blended score in the first quarter: it hides which signal moved.
Every signal is "per product area," so the taxonomy is the denominator. If the tree changes on every model rerun, your trend line measures the tree, not the product. The same Enterpret study found that two runs of the same AI harness, rated equally correct by generic checks, differed by 27 percentage points in leakage. As the paper puts it: "Surface plausibility is an insufficient measure of taxonomy quality."
Two checks before you publish a scorecard: are L3 labels informative, or do they just repeat the parent name? And can each L1 branch be handed to one team without arguing about overlap? If you can route feedback to the team that owns it, you can measure that team's area.
Enterpret's Adaptive Taxonomy builds an L1/L2/L3 product area to feature to sub-feature hierarchy from your docs and changelogs, then updates it as you ship, so the denominator stays stable without a quarterly re-tagging project. The Customer Context Graph joins each record to accounts, revenue, tickets, and owners, which is what makes revenue exposure and loop closure computable rather than estimated. Once sources from its 50+ integrations are connected and processed, each area's scorecard becomes a self-serve view.
The bigger shift is who reads it. PMs ask Wisdom "what changed in Billing this week, and which accounts?" and get exact records. Alerts post red cells to the owner's Slack channel, and the MCP server brings the same data into Claude or Cursor. Product Ops stops being the answer to every "what are customers saying?" and owns the system instead.
Picture a B2B SaaS company with six L1 areas. Monday's scorecard shows Reporting green except one cell: an emerging L3 theme, "scheduled export fails," at 14 records. Area negative share barely moved, so a sentiment chart would have missed it. Revenue exposure flags two accounts renewing inside 90 days. The PM links a Linear issue that day, and the trend line shows whether the fix worked. One signal, one owner, one action.
Health scores started at the account because that is where CRM data lived. As feedback, revenue, and work items converge in one graph, the product area becomes the natural unit. My hypothesis: the strongest Product Ops teams will review area health the way SRE teams review service health. Run the template for four weeks and tell me which signal breaks first.
Product area health is a measure of how customers experience one part of your product, such as Billing or Reporting, based on feedback mapped to that area. It tracks signals like negative share, normalized volume, trend, and revenue exposure, and rolls up to the owning team.
A customer health score rates an account, usually from adoption, engagement, and survey data, to predict churn. Product area health rates a part of the product across all accounts, so PMs can see which area is degrading and who owns the fix. Most teams need both, built from the same feedback.
Every signal is calculated per product area, so a taxonomy that overlaps or drifts corrupts every metric. Enterpret research found that AI-generated taxonomies leaked 34.7% to 76.4% of records across top-level product areas, versus about 20% for production references.
Weekly for trend and emerging themes, since those are early-warning signals, and monthly or quarterly for revenue exposure and loop closure in planning reviews.
Not at first. A weighted score hides which signal moved, and the signal tells the owner what to do. After a quarter of calibration, a composite can work for executive rollups if the per-signal view stays one click away.
If you are building this for multiple product teams, see how the teams closing the customer feedback loop at scale structure ownership, or see how Enterpret works.
Research cited
Lorem ipsum dolor sit amet, consectetur adipiscing elit. Suspendisse varius enim in eros elementum tristique. Duis cursus, mi quis viverra ornare, eros dolor interdum nulla, ut commodo diam libero vitae erat. Aenean faucibus nibh et justo cursus id rutrum lorem imperdiet. Nunc ut sem vitae risus tristique posuere.