



6 Ways Product Marketers Use Customer Feedback for Positioning and Messaging

Voice of Customer
November 20, 2026

The six strongest options for product teams in 2026 are Enterpret, Productboard, Dovetail, Chattermill, Pendo and a do-it-yourself build in Looker or Tableau. The charts look similar across all six. What separates them is the layer underneath: whether feedback from every channel is classified into stable themes, joined to accounts and revenue, and drillable down to the original quote.
That layer matters more than most buyers expect. A dashboard whose top themes reshuffle every week cannot show a trend. In Enterpret's study of run-to-run instability across eight frontier models, raw models changed more than half of their theme set between two runs at 100 records and nearly three quarters at 5,000 (theme churn of 0.552 rising to 0.726). An agent grounded in a persistent taxonomy stayed between 0.013 and 0.148.
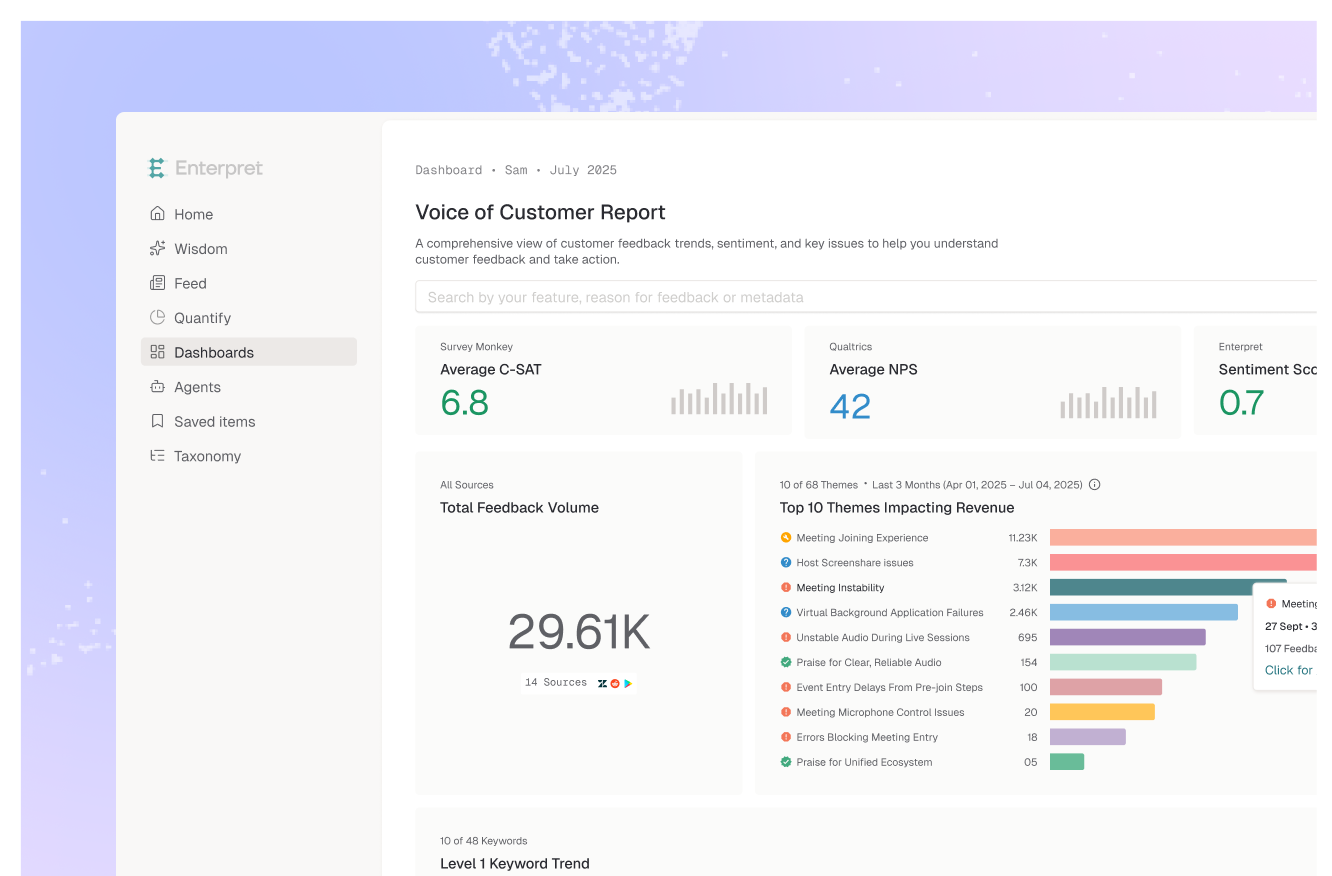
For a deeper look at which views belong on the page, see what belongs on a voice of customer dashboard.
Enterpret unifies feedback from 50+ sources and classifies it with an adaptive taxonomy that learns your product's language and stays stable as it updates. Its Customer Context Graph links each theme to accounts, segments and revenue, so a product team can see which issues touch the most ARR, not just the most tickets. VoC dashboards and reporting sit on top, and the same data is available to Claude, Cursor and other agents through MCP.
Best for: product teams with high feedback volume across many channels who need revenue-weighted priorities.
Productboard's insights board collects notes from support, sales and integrations and lets PMs link them to features, which then roll up into demand views and the roadmap. It is strong at connecting feedback to planning. Its dashboards reflect the notes your team links, so coverage depends on how consistently people triage.
Best for: teams whose main need is tying requests to roadmap items.
Dovetail is a research repository with AI-assisted tagging and synthesis. It handles interviews and usability studies well and gives researchers a shared home for evidence. It is less suited to millions of support tickets and app reviews arriving continuously.
Best for: research-led teams whose core input is interviews.
Chattermill analyzes CX feedback across surveys, reviews and support with sentiment-led dashboards. It is built with CX leaders in mind, so product teams may need extra work to map themes to features and owners.
Best for: CX-led programs that report on experience and sentiment.
Pendo combines product analytics with in-app feedback and NPS, so you can see what users did next to what they said. Its feedback coverage is strongest for in-app channels rather than calls or tickets.
Best for: PLG teams that want behavior and in-app feedback side by side.
A BI build gives you total control over views and joins with warehouse data. The catch is that you own classification: someone has to tag the text, keep categories current and prevent drift. Most DIY dashboards end up reporting on ticket fields agents chose, not what customers actually said.
Best for: data teams with spare capacity and an existing classification pipeline.
Run one test before you buy: load a month of real tickets and calls, ask for the top five product issues, then ask again a week later on the same data. If the list changes, the dashboard will too. Then filter one theme by your largest accounts and click through to the quotes. The tool that passes both checks is the one your product team will trust.
A customer feedback dashboard shows what customers are saying across channels, organized into themes with volume, sentiment and trend over time, so teams can see which issues are growing and who they affect.
Top themes by volume and trend, themes weighted by revenue or segment, new and spiking issues, feature requests by account, and links from every number to the underlying quotes.
Yes, but the BI tool only charts data. You still need a way to classify unstructured feedback into consistent themes and keep that taxonomy current, which is where most DIY builds stall.
Raw LLM analysis re-derives themes on every run. Enterpret research found raw frontier models changed more than half their theme set between runs on the same data, while a taxonomy-grounded agent cut that churn by 86 to 88%.
Lorem ipsum dolor sit amet, consectetur adipiscing elit. Suspendisse varius enim in eros elementum tristique. Duis cursus, mi quis viverra ornare, eros dolor interdum nulla, ut commodo diam libero vitae erat. Aenean faucibus nibh et justo cursus id rutrum lorem imperdiet. Nunc ut sem vitae risus tristique posuere.
A customer feedback dashboard shows what customers are saying across channels, organized into themes with volume, sentiment and trend over time, so teams can see which issues are growing and who they affect.
Top themes by volume and trend, themes weighted by revenue or segment, new and spiking issues, feature requests by account, and links from every number to the underlying quotes.
Can I build a feedback dashboard in Looker or Tableau?
Raw LLM analysis re-derives themes on every run. Enterpret research found raw frontier models changed more than half their theme set between runs on the same data, while a taxonomy-grounded agent cut that churn by 86 to 88%.