





The 7 Steps to Analyze Product Reviews From UK Retailers Like Argos and Very

Feedback Analysis
November 5, 2026

To decide which product bets to kill, pair your usage data with six signals from what customers actually say: complaints about the core product are growing while the bet's adoption stays flat, the feedback the bet was built to reduce has not declined, only non-ICP segments ask for it, the revenue behind the requests is small or sits in one account, customers are indifferent to it rather than upset about it, and it creates support load. When four or more show up together, kill the bet. Two or three means fix it against a deadline. Zero or one means keep going.
Picture a bet at 9% weekly adoption two quarters after launch. Analytics gives you that number precisely. It cannot tell you whether 9% is a discoverability bottleneck, a wrong-segment problem, or a false hypothesis. Only customer evidence separates those three.
Most guidance on product bets comes from the analytics side, and it gets a lot right. Amplitude's guide to smarter product bets makes a point every product leader should internalize: the most requested feature can come from your lowest retention users, so segment before you decide. Retention curves, funnels, and cohorts are the backbone of any bet review.
The gap is the why. Usage data does not measure what customers said, what they asked for instead, or whether the targeted problem still hurts. Teams fill that gap with anecdotes, which is how weak bets survive for four quarters.
Usage data tells you a bet is underperforming. Customer evidence tells you whether it is fixable. A kill decision needs both, measured with the same rigor.
Roni Ben Aharon, CPO of Craft.io, describes on Mind the Product retiring a visual spec tool rather than competing with Figma, framing sunsetting as creating space for more impactful work. The hard part is knowing which bet to kill.
This is the opportunity cost signal. If the bet's usage has plateaued while feedback on your core product areas (reliability, performance, the main workflow) climbs, customers are telling you where capacity should go. Plot both lines on one chart.
Every bet is a hypothesis about a customer problem. Write down the target theme before launch, then measure its volume for adopters versus non-adopters afterward. If the theme is as loud among adopters as before, the bet did not solve the problem, whatever the adoption number says.
Break requests and positive mentions down by segment, plan, and persona. If demand comes from accounts or verticals you are not targeting, the bet is pulling the roadmap toward customers you did not choose.
Join every request to account ARR and renewal date. Two patterns argue for a kill: total ARR asking is small relative to cost, or one account represents most of it. The second is a services commitment dressed as a product bet.
Negative feedback is a fix signal: people care enough to complain. Indifference is the kill signal: few mentions, mentions that read "fine" or "haven't tried it," and no requests for extensions.
Count tickets and how-to questions tagged to the bet, divided by active users. Few users with a high ticket rate is a tax on support and onboarding. Analyzing support tickets and chat transcripts at the feature level makes this cost visible.
Signal 2 is a before and after comparison, so if the categories shift between snapshots, any change could be the measurement, not the bet. This is where ad hoc LLM analysis breaks down. In Enterpret's study of run-to-run instability across eight frontier models, raw models asked the same question on the same feedback changed more than half of their theme set between two runs at 100 records, and nearly three quarters at 5,000 (theme churn of 0.552 rising to 0.726).
7.5 to 9.8% How much raw frontier models' reported volumes moved on the same themes between runs. A taxonomy-grounded agent showed zero volume disagreement across all 117 valid run pairs. Source: Enterpret Research, "Same Feedback, Different Answer" (arXiv, 2026)
If your measurement wobbles by up to 9.8% on its own, a modest decline in the target theme is noise. The study measures stability, not accuracy, but for a before and after decision stability is the prerequisite. Fix the taxonomy first, then compare.
Run every bet through the six signals at a fixed checkpoint. Read the pattern, not any single number.
| Usage data says | Customer evidence says | Call |
|---|---|---|
| Adoption flat or falling | Target theme unchanged, mentions indifferent, demand from non-ICP or one account | Kill |
| Adoption flat, high ticket rate per user | Core complaints rising, support load concentrated on the bet | Kill, and redirect capacity to the core |
| Adoption low | Adopters report the target theme less, sentiment negative about setup or discoverability | Fix: the value is real, the path to it is broken |
| Adoption growing | Support load rising, complaints about reliability | Fix: quality, not the bet |
| Adoption growing in ICP segments | Target theme declining, requests spread across many accounts | Keep and invest |
A simple scoring rule: four or more signals present means kill. Two or three means fix, with a named owner and a 60 to 90 day deadline. Zero or one means keep.
A kill that arrives as opinion gets relitigated every roadmap review. One that arrives as evidence holds. Write the memo in six parts:
Close the loop with those accounts before the announcement, not after. Mapping the bet's users against churned vs retained customer feedback also tells you whether any of them are already at risk.
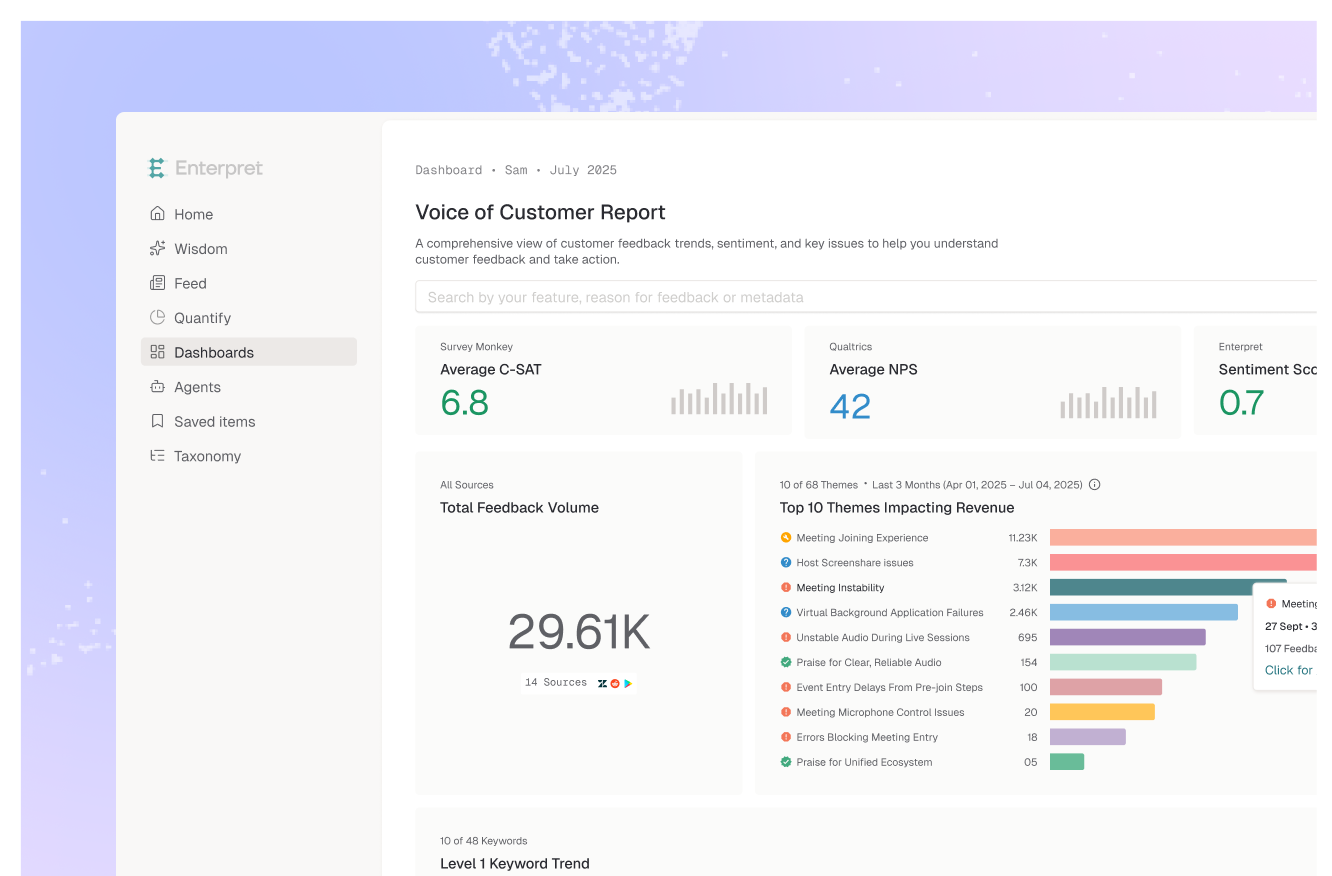
Each signal maps to a capability. The Customer Context Graph joins feedback to account, segment, ARR, renewal date, and owner (signals 3 and 4). Adaptive Taxonomy keeps L1, L2, and L3 categories consistent as you ship, so signal 2 holds quarter over quarter. Wisdom answers "How has feedback on bulk import changed among enterprise accounts since launch?" with the exact records behind the count. AI agents and alerts flag rising core complaints.
It pulls from 50+ integrations and complements your analytics rather than replacing it: connecting Amplitude behavioral data with qualitative feedback gives you both halves of the table above. The MCP server puts the same context into Claude, Cursor, and Notion for whoever drafts the kill memo. Expect to connect sources and let the graph build before your first review.
Picture a B2B SaaS team two quarters into an in-app reporting builder. Usage: 9% of accounts tried it, 3% weekly. The target theme, "can't get the data out," is as loud among adopters as non-adopters. Most ARR requesting more reporting sits in one account. Mentions read "haven't needed it." Sync reliability complaints climbed every month. Five of six signals: kill the builder, ship an export for the large account, and point the team at sync.
Boards now ask what each bet returned, and "adoption was lower than expected" is not an answer. The teams that compound kill fast with evidence, then reinvest where customers already point. Next step: quantify how customer feedback impacts revenue in Salesforce so the ARR column in your decision table is real. Then run the six signals on your weakest bet and see where the framework breaks.
Set the checkpoint before launch, typically one to two quarters, so adopters have time to generate feedback. A date fixed in advance prevents "one more sprint."
Neither wins by default. Low usage with negative, engaged feedback usually means fix. Low usage with indifferent feedback usually means kill. The disagreement itself is the diagnosis.
Only with care. In Enterpret's research, raw frontier models' counts on matched themes moved 7.5 to 9.8% between runs on the same data, while a taxonomy-grounded agent showed zero volume disagreement. Ground before and after comparisons in a fixed taxonomy.
Treat it as an account decision. Size the ARR and renewal risk, then offer a workaround, migration path, or scoped commitment instead of carrying a product surface for one logo.
Look at adopters. If adopters report the target problem less and complain about setup or discoverability, the value is real and the path is broken: fix it. If adopters report the problem just as often, the hypothesis was wrong: kill it.
If you are building a more rigorous bet review, see how Enterpret works.
Research cited
Lorem ipsum dolor sit amet, consectetur adipiscing elit. Suspendisse varius enim in eros elementum tristique. Duis cursus, mi quis viverra ornare, eros dolor interdum nulla, ut commodo diam libero vitae erat. Aenean faucibus nibh et justo cursus id rutrum lorem imperdiet. Nunc ut sem vitae risus tristique posuere.


