



The 10 KPIs Product Ops Should Track for Customer Feedback

Product
November 3, 2026

A VP of Product should report seven customer health signals to the board: the top feedback themes weighted by ARR, the product issues behind at-risk renewals, product-driven churn reasons, competitive mentions, regressions after launches, expansion blockers, and what changed since last quarter along with what product did about it. Every one of them ties what customers say to revenue and to a decision the product org owns.
That is the version of customer health only the product leader can bring.
In most board decks, customer health is one CS slide: a health score distribution, net revenue retention, a few logos marked red. It answers one question. Which accounts are at risk?
The board's next question is always why, and what product is doing about it. That answer sits upstream of every health score, in tickets, sales calls, NPS verbatims and reviews. Without numbers, the board gets anecdotes.
A board can forgive a bad quarter. It won't forgive numbers that can't be defended.
CS reports who is at risk. Product reports why, how much revenue sits behind it, and what changed because of it. That is Customer Intelligence at the board level.
Each one is something a product leader can measure, explain and move with a product decision.
Show the five themes with the most revenue behind them, not the most mentions. For each, give the ARR of accounts raising it and the direction since last quarter.
Defend it with: a consistent product taxonomy (product area, feature, sub-feature) and every piece of feedback joined to its account and contract value.
Take every account renewing in the next two quarters that CS flags as at risk. Then show which product issues those accounts raise most, and the ARR attached to each one. This is where your work and your alerts on at-risk accounts before they churn meet the CS health score.
Defend it with: renewal dates and owners on the same record as the feedback, so nobody has to reconcile a CRM export by hand.
Split last quarter's churned ARR into product reasons (missing capability, reliability, usability) and non-product reasons (budget, champion left, acquisition).
Defend it with: evidence from what churned accounts said in the months before they left, not just the exit survey. Our guide to software to analyze why customers churn covers how teams get there.
Report which competitors customers and prospects name, in which product areas, and how much ARR sits with the accounts naming them. Tracking which competitors customers switch to when they churn turns a vague threat into a specific gap.
Defend it with: mentions pulled from sales calls, tickets and reviews together.
For every major release last quarter, show feedback volume and sentiment on that product area before and after. Call out anything that got worse.
Defend it with: the same categories in both windows. Surfacing a regression first beats being asked about it.
Health is not only defense. Show the top requests from accounts with open expansion opportunities or upsell potential, and the pipeline value attached.
Defend it with: requests linked to opportunity data, so "customers want this" becomes "this is worth this much pipeline."
Close the loop: what you committed to last quarter, what shipped, and how the related themes moved.
Defend it with: trends you can compare quarter over quarter, which only works when categories stay stable as you ship.
Keep it to one slide, two at most.
| Slide zone | What goes there | Signals |
|---|---|---|
| Headline | One sentence: the biggest customer health shift this quarter and its revenue impact | All |
| Revenue at risk | Top 3 ARR-weighted themes, plus the issues behind at-risk renewals | 1, 2 |
| Why we lost | Product vs non-product churn ARR, top competitor and the gap behind it | 3, 4 |
| Launch scorecard | What shipped, what improved, any regression and its fix date | 5, 7 |
| Growth | Top expansion blockers and the pipeline behind them | 6 |
| Ask or decision | The one tradeoff you want the board's view on | All |
If NPS is already part of the board pack, pair this slide with it rather than replacing it. Our guide to automating executive NPS reporting covers keeping that number current.
Paste a quarter of feedback into a general-purpose AI model, ask for top themes twice, and you get two different answers.
Enterpret's study of run-to-run instability across eight frontier models found that a raw model changed more than half of its top themes between two runs at 100 records, and nearly three quarters at 5,000 records (theme churn of 0.552 rising to 0.726). An agent grounded in a persistent taxonomy reported identical volumes for matched themes across every valid run pair. Stability is not accuracy, but for a board slide it is the floor.
86 to 88% Reduction in theme churn when an AI agent is grounded in a persistent taxonomy instead of re-clustering raw feedback on every run. Source: Enterpret Research, "Same Feedback, Different Answer" (arXiv, 2026)
Revenue weighting has the same requirement. Enterpret research comparing Agentic RAG, a Deep Research Agent, and a context graph agent notes that "a top-k retrieval result cannot establish corpus prevalence." A tool can find the right quotes and still attach the wrong count.
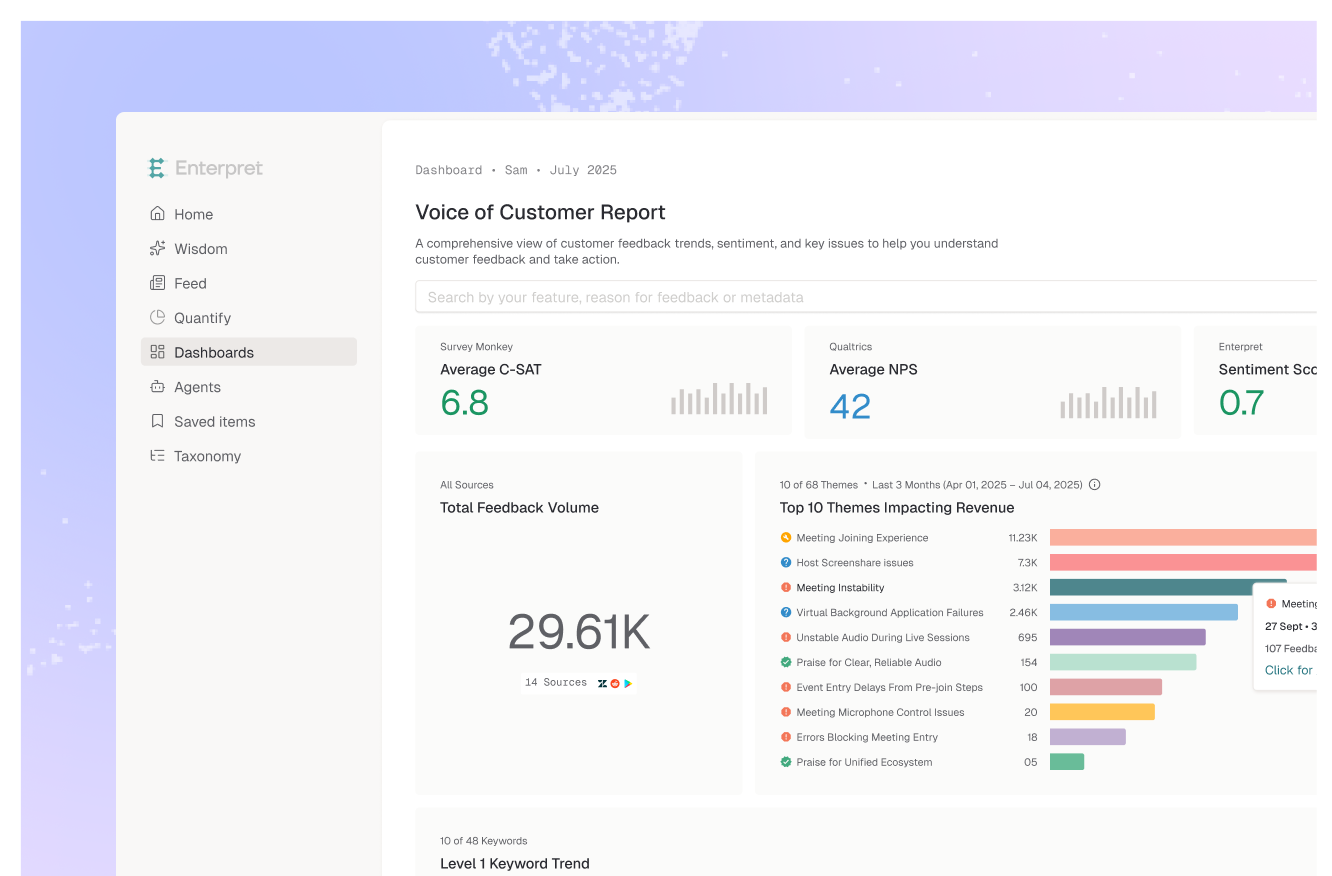
Enterpret is a Customer Intelligence platform built for this layer. It connects 50+ feedback sources into one source of customer truth.
Connecting sources and building the graph takes integration and processing time. Once live, the board slide stops being a fire drill.
Picture a VP of Product heading into a Q4 board meeting with a handful of renewals flagged at risk.
Instead of quoting angry tickets, she shows that one permissions theme sits behind most of the at-risk ARR, that it rose after a Q3 admin redesign, and that a competitor appears in the same conversations. Then she shows the fix date and the target for that theme by next meeting.
Same data CS already had. Completely different conversation.
Boards are getting sharper about the gap between a health score and the reasons behind it. The product leader with revenue-weighted, repeatable customer signals owns the most important story in the room.
Customer health is becoming a product metric. The companies that treat it that way will build what customers pay to keep.
Report seven signals: top feedback themes weighted by ARR, issues behind at-risk renewals, product-driven churn reasons, competitive mentions, regressions after launches, expansion blockers, and what changed since last quarter with what product did about it. Each links feedback to revenue and to a product decision.
Customer Success usually reports which accounts are healthy or at risk, based on usage, engagement and relationship signals. The product leader reports why, by quantifying the product themes behind that risk and showing what the roadmap did about them.
Volume tells you how often something is said, not how much revenue depends on it. A theme raised by a few enterprise accounts renewing next quarter can matter more than one raised by hundreds of free users.
Use them to draft, but be careful with the numbers. Enterpret's research on eight frontier models found that a raw model changed more than half its top themes between two runs on the same 100 records, and that with the model held constant, a taxonomy-grounded agent cut theme churn by 86 to 88%. For figures you will defend in front of a board, ground the AI in a persistent taxonomy and account data.
Every board meeting, which for most companies means quarterly. The key is that categories stay consistent between meetings, so the board sees real trends instead of a fresh snapshot each time.
If you want board-ready customer signals weighted by revenue and consistent quarter over quarter, see how Enterpret works.
Research cited
Lorem ipsum dolor sit amet, consectetur adipiscing elit. Suspendisse varius enim in eros elementum tristique. Duis cursus, mi quis viverra ornare, eros dolor interdum nulla, ut commodo diam libero vitae erat. Aenean faucibus nibh et justo cursus id rutrum lorem imperdiet. Nunc ut sem vitae risus tristique posuere.