





The 7 Steps to Analyze Product Reviews From UK Retailers Like Argos and Very

Feedback Analysis
November 5, 2026

Product leaders use customer feedback to set annual strategy in seven steps: build a year-over-year view on a stable taxonomy, weight every theme by revenue and segment, separate loud from large, commit to 3 to 5 strategic bets backed by evidence, decide explicitly what not to do, attach a customer-signal success measure to each bet, and re-check the bets every quarter.
Annual strategy is not a roadmap. A roadmap is sequencing. Strategy is where the product org puts its money, what it walks away from, and the story you defend to the CEO and board.
Every product leader says their strategy is customer-driven. Few can prove it when the CFO follows up.
Support has ticket tags. Sales has a spreadsheet of deal blockers. CS has renewal notes. Everyone walks into planning with a different picture of the customer, and the first two hours go to arguing about whose data is right.
Then the categories reset. The trend line the board saw in Q4 cannot be reproduced in Q1. That is not a strategy problem. It is an upstream data problem, and it quietly kills credibility.
The shift: stop treating customer feedback as an input you consult once a year. Treat it as Customer Intelligence, a persistent layer joined to accounts and revenue, that your strategy is built on and measured against all year.
Strategy starts with one question: what changed in the last twelve months? You cannot answer it if your categories change every time someone runs the analysis. You need one taxonomy, product area to feature to sub-feature, applied across every channel and quarter, that evolves as you ship without breaking history.
This matters more now that teams paste feedback into an LLM and ask for "top themes." In Enterpret's study of run-to-run instability across eight frontier models, a raw model changed more than half of its theme set between two runs at 100 records, and nearly three quarters at 5,000 records. A taxonomy-grounded agent stayed far lower at every size.
0 of 117 Run pairs where a taxonomy-grounded agent reported a different volume for the same theme. Raw models' counts moved 7.5 to 9.8% on matched themes. Source: Enterpret Research, "Same Feedback, Different Answer" (arXiv, 2026)
Stable is not the same as correct. But numbers that move every time you ask are not defensible at all.
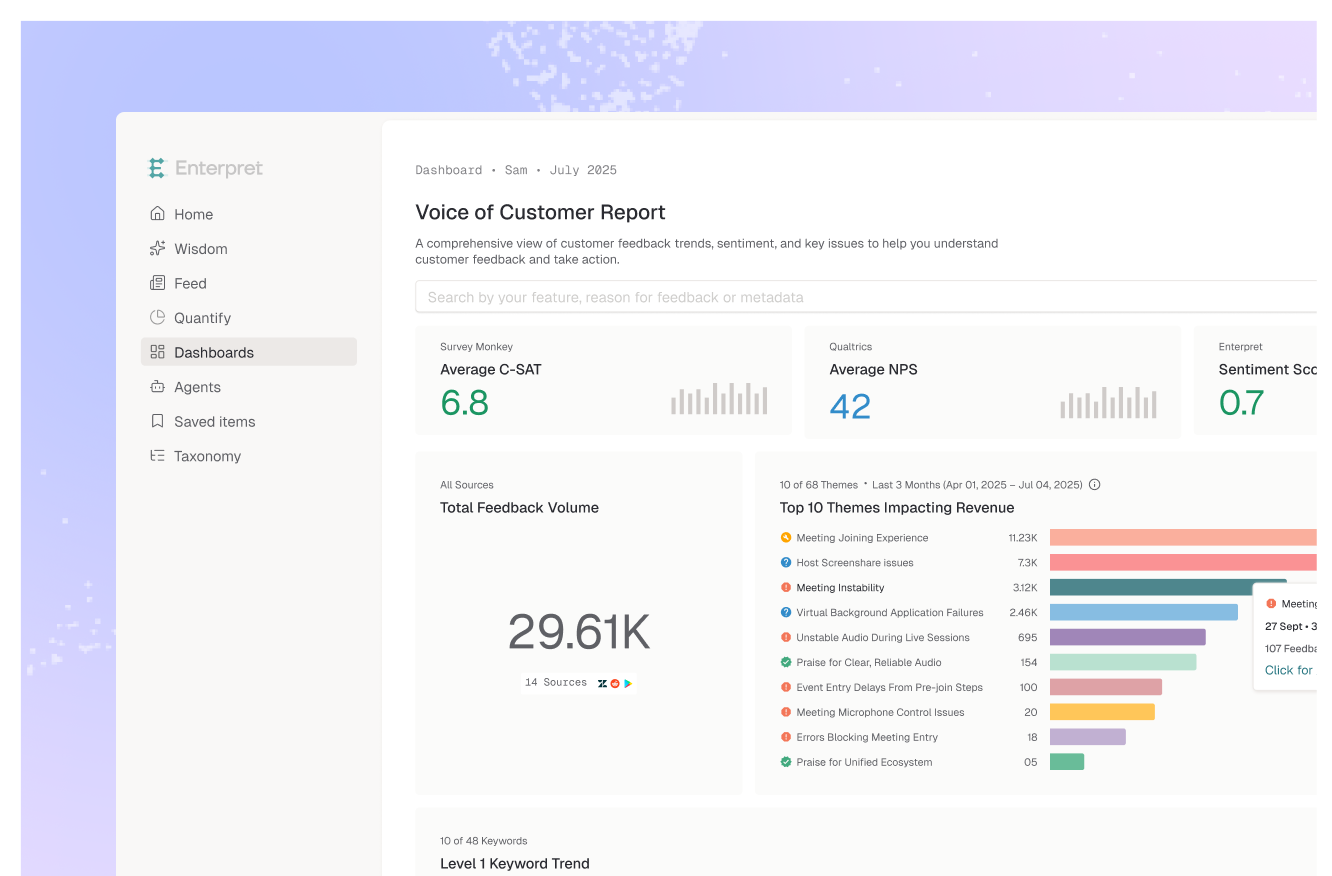
Volume tells you how often something is said, not what it is worth. Join each piece of feedback to the account behind it: ARR, segment, plan, renewal date, owner. Now every theme carries three numbers, not one: how many customers, how much revenue, and which segments. A theme with 40 mentions from your enterprise tier can outweigh one with 400 from free users. That is the core of quantifying how customer feedback impacts revenue in Salesforce.
Loud themes dominate Slack and escalations. Large themes quietly span hundreds of accounts and real revenue. Strategy is built on large.
| Signal | Loud | Large |
|---|---|---|
| Source | One escalation, one big logo, one viral post | Repeated across channels and accounts |
| Trend | Spikes, then fades | Persists or grows year over year |
| Revenue | Concentrated in a few accounts | Spread across a segment you want to grow |
| Right response | Account plan or fix | Strategic bet candidate |
Retrieval alone will not make this call for you. Enterpret research comparing Agentic RAG, a Deep Research Agent, and a context graph agent put it plainly: "a top-k retrieval result cannot establish corpus prevalence." You need real denominators, not the most quotable examples.
Cluster the large, revenue-weighted themes into bets, not features: "make onboarding self-serve," "close the enterprise security gap."
Three to five is the right number. Fewer and you are not hedging. More and you are not choosing. Each bet gets a one-page evidence block:
The "stop" list is the most underrated artifact in product strategy. Use the same evidence to retire investments: features with flat usage and no feedback signal, themes concentrated in segments you are deprioritizing, and pet projects with no customer pull.
Write it down and share it with sales and CS. Saying no with data beats saying no with opinion.
Every bet needs a measure that comes from customers, not just from shipping. Examples:
Pair each with a business metric: gross retention, expansion, win rate. Then the board hears whether customers felt it, not just what shipped.
A strategy reviewed only annually is a guess with a long shelf life. Each quarter, rerun the same view on the same taxonomy: is the theme moving, is revenue exposure changing, has a new large theme emerged?
Double down where the signal is growing. Kill or reshape the rest. This is what the customer feedback maturity model looks like at its top stage: feedback is not a report, it is the operating system for decisions.
Steps 1 through 3 are where most product orgs stall, because they depend on infrastructure, not effort. That is the layer Enterpret is built to be.
Connecting sources and building the graph takes integration and processing time. Once it is in place, teams argue about decisions, not data. For more on the category, see the best AI-native customer intelligence platforms.
Picture a VP of Product at a mid-market SaaS company heading into annual planning. The loudest request all year was a custom reporting builder, pushed hard by two large accounts.
She pulls the year-over-year view. Reporting is steady. But permissions and admin controls grew every quarter, span most of the enterprise segment, and recur in churned-account feedback. Loud versus large, resolved in one view.
She commits to four bets. Enterprise admin is one, measured by that theme's share of churned-account feedback. The custom builder goes on the stop list; the two accounts get an account plan instead. By Q2 the admin theme is falling among renewing accounts. She brings that chart, not a feature list, to the board.
The test of a feedback-driven strategy: can you show the board, quarter by quarter, that customers noticed the bets you made?
The annual offsite deck is dying. Strategy is becoming a living system: bets set once a year and checked against customer signals every quarter.
The product leaders who win the next five years will own that Customer Intelligence layer upstream of every planning conversation. Everyone else will keep arguing about whose spreadsheet is right.
Strategy decides where the product org invests, what it stops, and how it will measure success at the portfolio level. Roadmap planning sequences the work inside those choices. Customer feedback should shape the strategic themes first, then inform the roadmap that delivers them.
Three to five: enough to cover more than one growth lever, few enough that each gets real investment. Every bet needs its own evidence block and customer-signal success measure.
For exploration, yes. For numbers you will defend to a board, be careful: Enterpret's stability study found raw frontier models changed more than half their theme set between two runs on the same data, and their counts moved 7.5 to 9.8% on matched themes. A taxonomy-grounded approach kept volumes identical across all 117 valid run pairs.
Check whether it persists across quarters, appears across channels and accounts, and carries meaningful revenue in a segment you want to grow. A theme driven by one escalation or one big logo is loud. One that shows up everywhere and grows year over year is large.
Pair a customer-signal measure with a business metric. For example, show the target theme shrinking in churned-account and renewal feedback alongside gross retention for that segment. Because the taxonomy is stable, the before and after are directly comparable.
If you are rebuilding how your product org turns customer signals into strategy, see how Enterpret works.
Research cited
Lorem ipsum dolor sit amet, consectetur adipiscing elit. Suspendisse varius enim in eros elementum tristique. Duis cursus, mi quis viverra ornare, eros dolor interdum nulla, ut commodo diam libero vitae erat. Aenean faucibus nibh et justo cursus id rutrum lorem imperdiet. Nunc ut sem vitae risus tristique posuere.


