






The 7 Steps to Analyze Product Reviews From UK Retailers Like Argos and Very

Feedback Analysis
November 5, 2026

To build a business case for a new product line with customer data, work in seven steps: find the demand signal in what existing customers already say, size it by accounts, segments and ARR, validate it with prospects and lost deals, estimate attach and expansion as ranges, net out cannibalization and support load, write down the evidence that would kill the idea, and structure the whole case for a CFO. The order matters. Each step turns a story into a number the next step can test.
Most guides here date from when "customer data" meant a survey. Today the CFO asks how many accounts, which segments, how much ARR, and then asks again a week later. If the count moves, the case is over.
The typical case rests on three loud enterprise customers, a sales leader's hunch, and a competitor launch, with numbers assembled by hand from Zendesk exports and Gong snippets and no denominator. That works until someone asks "out of how many?"
The faster shortcut has its own bottleneck. In Enterpret's study of run-to-run instability across eight frontier models, raw LLM counts on matched themes drifted between runs, while an agent grounded in a persistent taxonomy reported identical counts every time.
7.5 to 9.8% How much raw frontier models' theme counts moved between runs on the same data. The taxonomy-grounded agent showed zero volume disagreement across all 117 valid run pairs. Source: Enterpret Research, "Same Feedback, Different Answer" (arXiv, 2026)
A new product line business case is not a forecast. It is a set of falsifiable claims about demand, each tied to accounts you can name and revenue you can count.
Your current base is the cheapest market research you will run. Look across tickets, calls, reviews and community threads, not only the feature request board, for three signals:
Mentions are not demand. Convert every signal into four numbers: distinct accounts, their segment distribution, the ARR of those accounts, and the trend across the last two to four quarters. Then add the denominator: the share of each segment that shows the signal.
Retrieval-style tools fall short here. Enterpret research comparing Agentic RAG, a Deep Research Agent and a context graph agent notes that "a top-k retrieval result cannot establish corpus prevalence." Every record needs an account, which means joining feedback to CRM data to quantify how customer feedback impacts revenue in Salesforce. Segment concentration also tells you what you are building: if most signal ARR sits in enterprise, this is an enterprise SKU.
Customers show expansion; prospects and lost deals show new logo pull. Pull recent closed-lost reasons and transcripts: how often did the capability come up, and did we lose to a vendor that bundles it? The analysis that shows which competitors customers switch to when they churn shows which bundles beat you in deals.
Then test willingness to pay with design partners: a paid pilot or letter of intent, not "would you use it."
Never present one number. Build low, base and high cases, each tied to a stated assumption, and split signaling from non-signaling accounts, since they attach at very different rates. Model expansion separately, and time to attach as a ramp. Your own past add-on launches are better analogs than industry benchmarks.
Gross attach is not net new ARR. Subtract revenue from accounts whose workaround runs on a higher tier or whose planned upgrade the SKU would replace. Then size the cost side: feedback on the adjacent workflow shows the ticket categories you will inherit, and your nearest product area gives a tickets-per-account baseline. Flag partner conflict if you integrate with the tool you plan to replace.
Write kill criteria before you present. Amazon's working-backwards process is built so weak ideas fail on paper; GeekWire's account of the process notes that a failed recommendation service "would have either died a quick conceptual death" before any code was written. Three thresholds (numbers illustrative):
Signal flat or declining over two quarters, or under a set share of the target segment (say, 10% of accounts).
Fewer than a set number of design partners in paid pilots (say, 5 of 20).
Over a set share of pilot ARR displacing existing revenue (say, 30%) means repackaging, not a new product.
Lead with the ask, keep sensitivity on one page, and footnote every number to the query that produced it.
| Section | The CFO's question | Evidence that answers it |
|---|---|---|
| Recommendation and ask | What do you want, and by when? | Headcount, quarters, decision date |
| Demand | Is this real? | Accounts, segments, ARR, trend, quotes linked to source records |
| Validation | Will new buyers pay? | Lost-deal share, pilot conversions |
| Revenue model | How much, and when? | Attach ranges, price assumptions, ramp |
| Net impact | What does it cost elsewhere? | Cannibalization, support load, margin |
| Risks and kill criteria | When do we stop? | Thresholds and review dates |
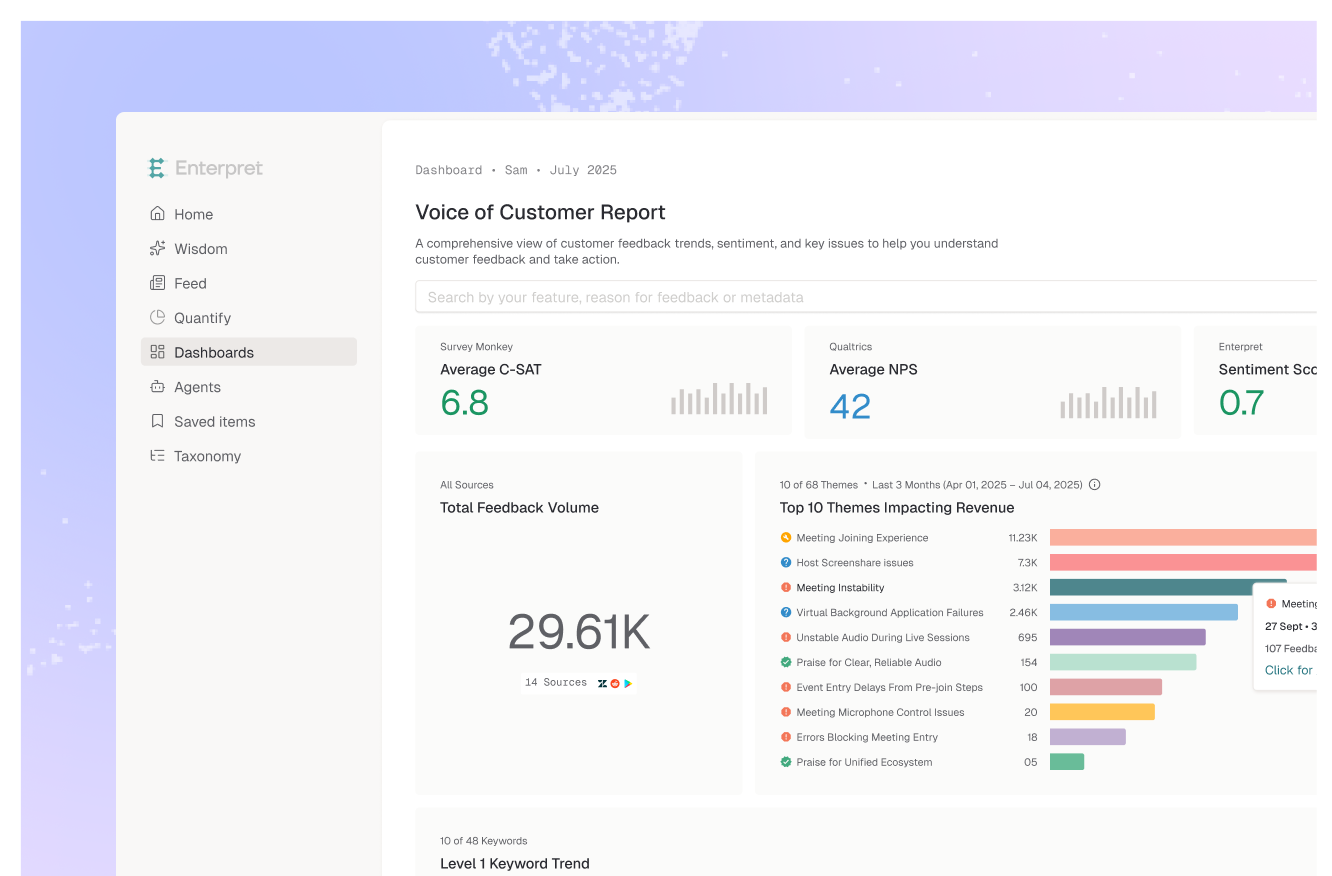
Steps 1 to 3 are where PMs lose weeks, because evidence lives in tools that share neither a taxonomy nor an account ID. Enterpret connects sources like Zendesk, Intercom, Gong, Salesforce, HubSpot and G2 into one evidence base. Adaptive Taxonomy keeps themes on a consistent L1/L2/L3 product-area structure that updates as you ship, so workarounds and adjacent-job requests become countable themes. The Customer Context Graph joins every theme to accounts, segments and ARR, turning step 2 into a query. Wisdom answers with the exact records behind each number, and the MCP server brings that evidence into Claude, Claude Code or Cursor while you draft.
The honest caveat: the graph needs integrations and processing time, so start before the planning cycle. After approval, Slack alerts can watch your kill criteria.
Picture a mid-market analytics company with 4,000 accounts (all numbers illustrative). The PM finds 310 accounts exporting data to spreadsheets to build forecasts, many pairing the product with a standalone forecasting tool. Those accounts carry $14M in ARR, 70% of it in two segments with 1,200 accounts combined. The capability came up in 18% of closed-lost enterprise deals.
Year-one attach in the 1,200-account segment is modeled at 5%, 9% and 14%, at an assumed $15K add-on price: $0.9M, $1.6M and $2.5M gross. Twenty percent of attaching accounts were already planning a tier upgrade, so the base case nets to about $1.3M. The kill criteria: fewer than 5 of 20 design partners in paid pilots by end of Q2, or displaced revenue above 30%.
What worked: demand numbers held across three reviews. What did not: the support-load estimate was weakest, and the CFO wanted pilot data before committing headcount. The case got funded as a stage-gated bet, which is a good outcome.
As customer evidence becomes queryable, business cases move from annual decks to living documents. PMs who win funding will be the ones whose numbers reproduce on demand. If you still assemble evidence by hand, the customer feedback maturity model is a useful way to see what has to change first. Run these steps on your next SKU proposal and tell your team where the evidence breaks.
Use unsolicited feedback from existing customers (tickets, calls, reviews, community) to find workarounds, adjacent-job requests and paired competitor tools, joined to CRM data so every signal has an account, segment and ARR.
Split the base into accounts that show the demand signal and accounts that do not, and model each at a different rate. Present low, base and high cases tied to named assumptions, calibrated against your own past add-on launches.
Identify accounts whose workaround uses a higher tier, or whose planned upgrade the new SKU could replace, and subtract that revenue from gross attach. Report net new ARR and set a cannibalization ceiling as a kill criterion.
For exploration, yes. For CFO-grade numbers, be careful: Enterpret's study found raw frontier models' counts on matched themes moved 7.5 to 9.8% between runs, while a taxonomy-grounded agent showed zero volume disagreement across 117 valid run pairs. Stability is not accuracy, but a count that changes on rerun will not survive review.
Anecdotes without a denominator, a single-point forecast, ignored cannibalization, and no stated conditions for stopping. Sizing in accounts and ARR, showing ranges, and naming kill criteria answers the follow-ups early.
If you are sizing a new product line and want account and ARR evidence behind every theme, see how Enterpret works.
Research cited
Lorem ipsum dolor sit amet, consectetur adipiscing elit. Suspendisse varius enim in eros elementum tristique. Duis cursus, mi quis viverra ornare, eros dolor interdum nulla, ut commodo diam libero vitae erat. Aenean faucibus nibh et justo cursus id rutrum lorem imperdiet. Nunc ut sem vitae risus tristique posuere.


